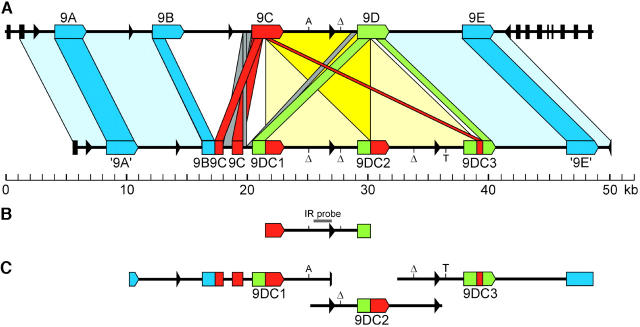
Figure 2.—
Schematic of the relationships between the Cf-9 and 9DC clusters and of several genomic DNA fragments used in this study. (A) Relationships between the Cf-9 and 9DC clusters. The Cf-9 cluster was previously described (Parniske et al. 1997). Colored arrowed boxes represent complete Hcr9's; colored rectangular boxes represent Hcr9 pseudogenes. Cf-9 (9C)-like sequences are depicted in red; 9D-like sequences in green; other Hcr9 sequences in blue. All Hcr9's and Hcr9 fragments in the Cf-9 and 9DC clusters are in the 5′-3′ orientation. Black arrows and bars represent LipoxygenaseC exons, and the arrows indicate the polarity of transcription of the 3′-exon. Boxes connecting the Cf-9 and 9DC clusters indicate orthologous regions. Note that in the central part of the 9DC cluster an 8.7-kb repeat is present that is almost identical to a region in the Cf-9 cluster (see also B). These regions are connected by light yellow boxes, which overlap in the dark yellow triangle. A and T indicate single polymorphic nucleotides in these regions; “Δ” represents a single nucleotide deletion. (B) The 8.7-kb DNA sequence fragment that is present once in the Cf-9 cluster and as a direct repeat in the 9DC cluster. This fragment includes the 3′-half of Cf-9, the Cf-9/9D intergenic region, and the 5′-half of 9D. The position of the Cf-9-9D IR probe is indicated by a gray horizontal bar above the fragment. (C) Genomic fragments containing one of the three 9DC genes that were cloned in a binary expression vector for agroinfiltration studies to determine their ability to confer Avr9 responsiveness.

