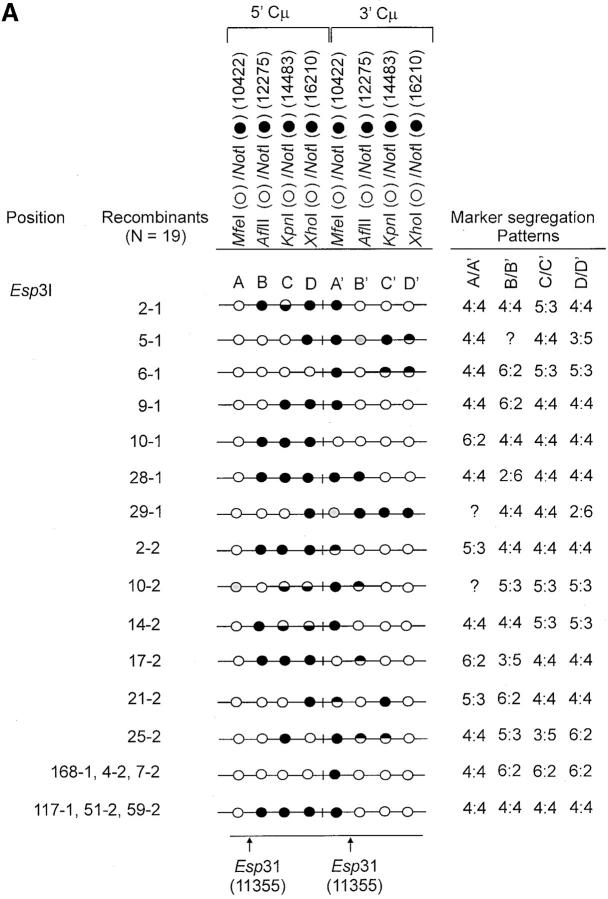
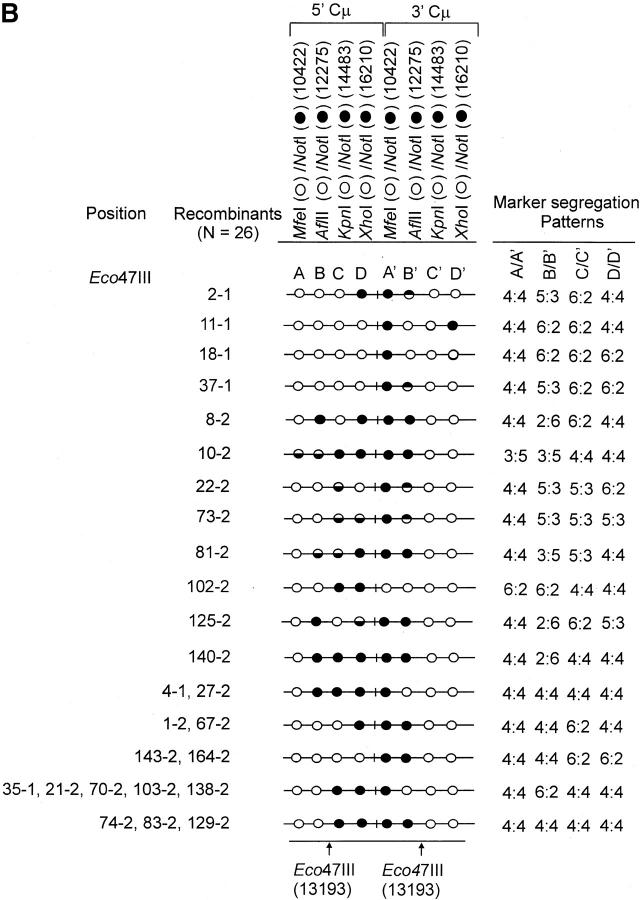
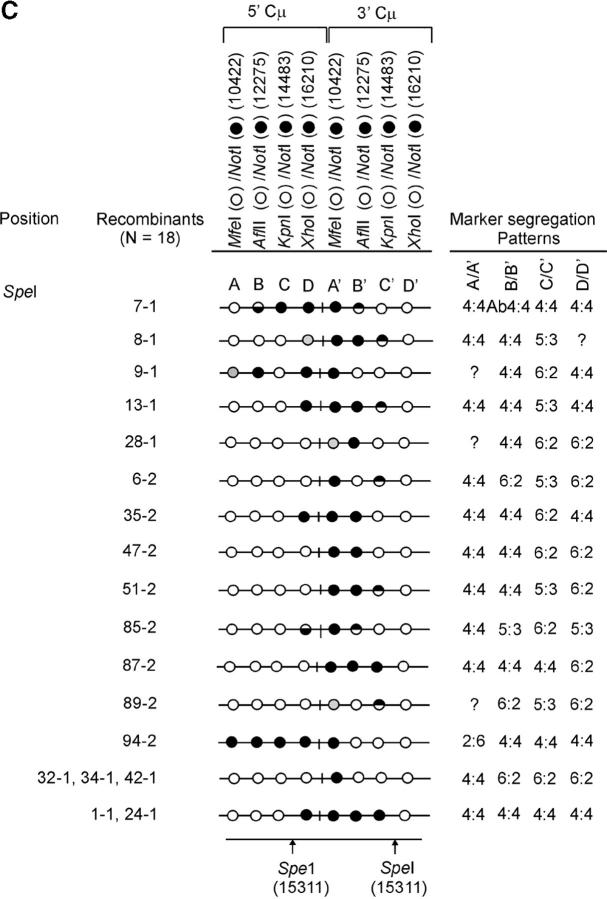
Figure 4.—
Genetic marker analysis. The genetic marker patterns are presented for the 5′ and 3′ Cμ-region duplication in independent recombinants derived following transfection with the (A) Esp3I-cut, (B) Eco47III-cut, and (C) Spe-I-cut enhancer-trap vectors. For simplicity, unnecessary details of the recombinant Cμ-region duplication shown in Figure 3B are omitted. The Cμ-region positions that are sensitive to cleavage with one of the chromosomal restriction enzymes (MfeI, AflII, KpnI, and XhoI) are indicated by open circles, while those sites that are cleaved with NotI, diagnostic of the vector-borne palindrome sequence, are denoted by solid circles. The Cμ-region marker positions exhibiting a mixed cleavage pattern with NotI and the corresponding chromosomal restriction enzyme are denoted by half-solid circles (sectored sites). In those instances in which sectored sites resided in both members of the recombinant Cμ-region duplication, the indicated “trans” marker configuration was established through analysis of individual subclones (originating from a single cell) as detailed earlier (Li and Baker 2000). Those Cμ positions devoid of either a chromosomal or a vector marker are indicated by shaded circles. The position corresponding to the DSB site is presented at the bottom of each diagram relative to the genetic markers in the 5′ and 3′ Cμ regions. The segregation class of each pair of allelic markers is based on the nomenclature in Figure 2.


