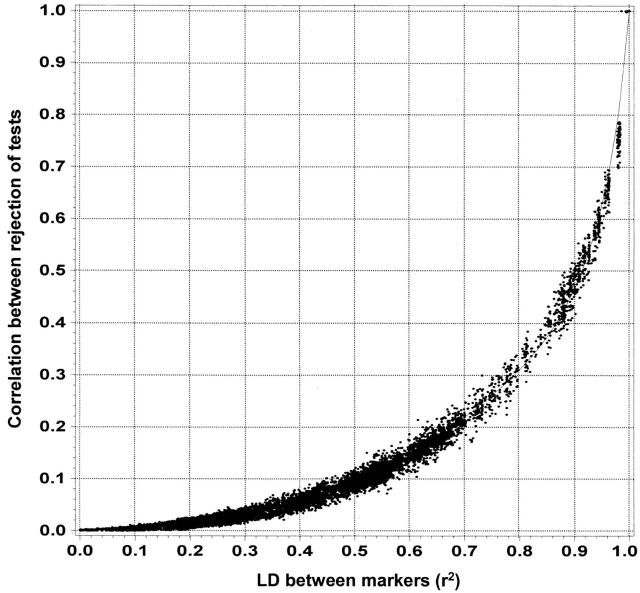
Figure 1.—
Correlation between single-marker tests and LD. The correlation between two single-marker tests rejecting the null hypothesis of no association (along the y-axis) plotted as a function of the LD between the tests (along the x-axis) is shown. LD is measured as r2 (Equation 10). The line shows the empirically fitted function that was used to predict correlation between the tests on the basis of LD between the markers.

