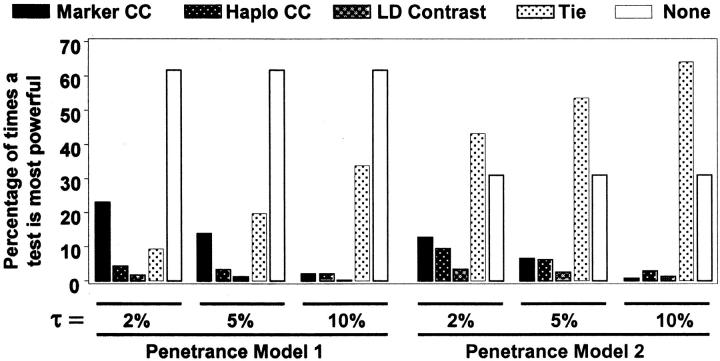
Figure 2.—
Proportion of trials for which each test was most powerful. The proportion of three-locus sets for which a given test was the most powerful by at least τ%, where τ was set to 2, 5, or 10%, is shown. A tie was declared if the top two tests were within τ% of each other. The test with the highest power had to achieve at least 40% power to be considered successful. The category denoted “none” included those sets for which no test achieved ≥40% power.

