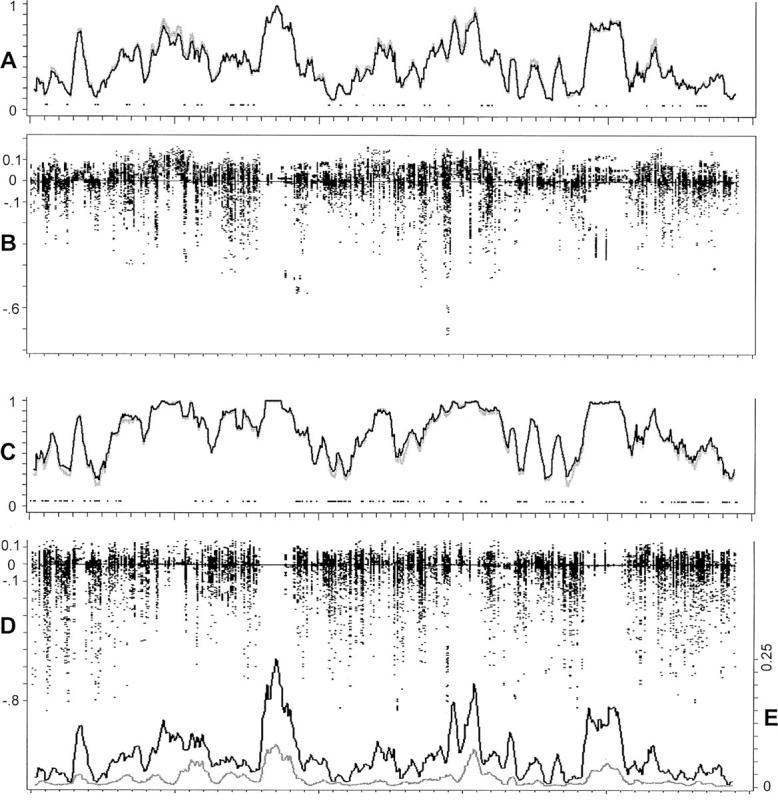
Figure 3.—

Summary results for power comparisons along the chromosome. The horizontal axes represent the relative positions of the chromosome 12 SNPs (Zaykin et al. 2002, map not to scale). (A) Rolling averages for the power of the single-marker case-control tests (shaded line) and the haplotype-based case-control test (solid line) under penetrance model 1 (small effects). (B) Each point represents the difference between the power of the single-marker case-control test and that of the most powerful haplotype test under penetrance model 1 (see text for details). (C) Rolling averages as in A, but under penetrance model 2 (larger effects). (D) Differences in power as in A, but under penetrance model 2. (E) Rolling averages of pairwise (solid line) and three-locus (shaded line) LD along the chromosome. The scale of these values is given along the axis to the right.
