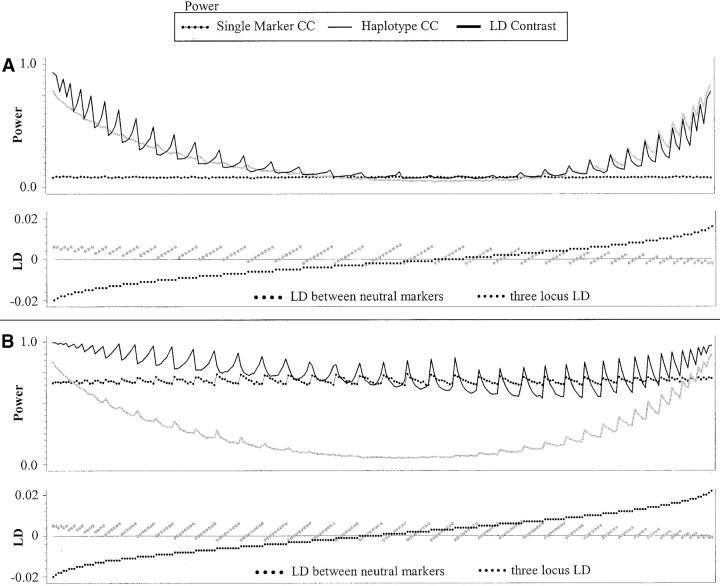
Figure 4.—
Power results for a subset of the iterative simulations. Power results for the three tests (single-marker case-control, haplotype-based case-control, and LD contrast) under different LD patterns for penetrance model 2 are shown. A includes all results for which pairwise LD between the markers and the functional site are low (Dkr = 0 and Dir = 0.01). B displays results for stronger LD (Dkr = 0.02 and Dir = 0.04). The bottom parts of A and B show the combination of three-locus LD and pairwise LD between the two neutral markers for each point along the power curve at the top. The values of pairwise LD between the markers have been scaled by a factor of 1/20.

