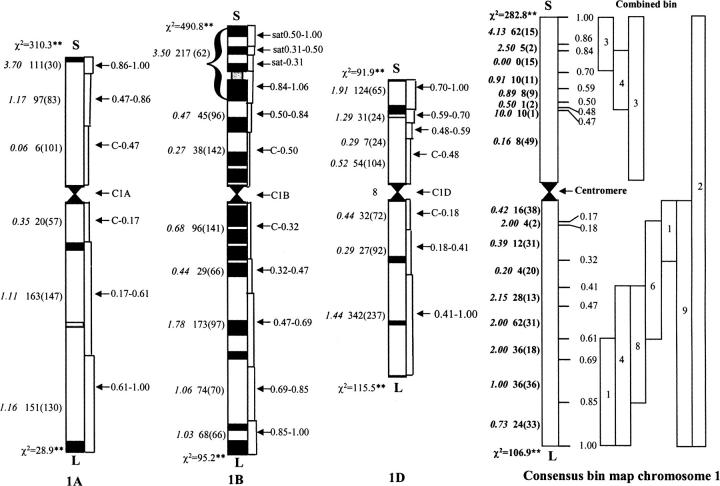
Figure 1.—
EST deletion bin maps of wheat chromosomes 1A, 1B, and 1D and the consensus group 1 chromosome. Numbers of EST loci mapped only to chromosomes and chromosome arms were not shown in the individual chromosome bin maps. The numbers of mapped EST loci (expected numbers are in parentheses) and the gene density (italic type) are shown on the left of each chromosome and the intervals are indicated on the right. The 1BS satellite region is incorporated into bin 1BS-0.84-1.06. On the left of the consensus chromosome bin map are the numbers of ESTs (expected numbers are in parentheses) and gene density (italic type) and on the right are the fraction lengths. In the consensus chromosome bin map, the boxes on the right represent the combined bins and the number of ESTs is shown inside the boxes. χ2 was used to test for random distribution of EST loci/probes on chromosome arms. * and **, significance of 0.05 and 0.01 probability, respectively.

