
Figure 4.—
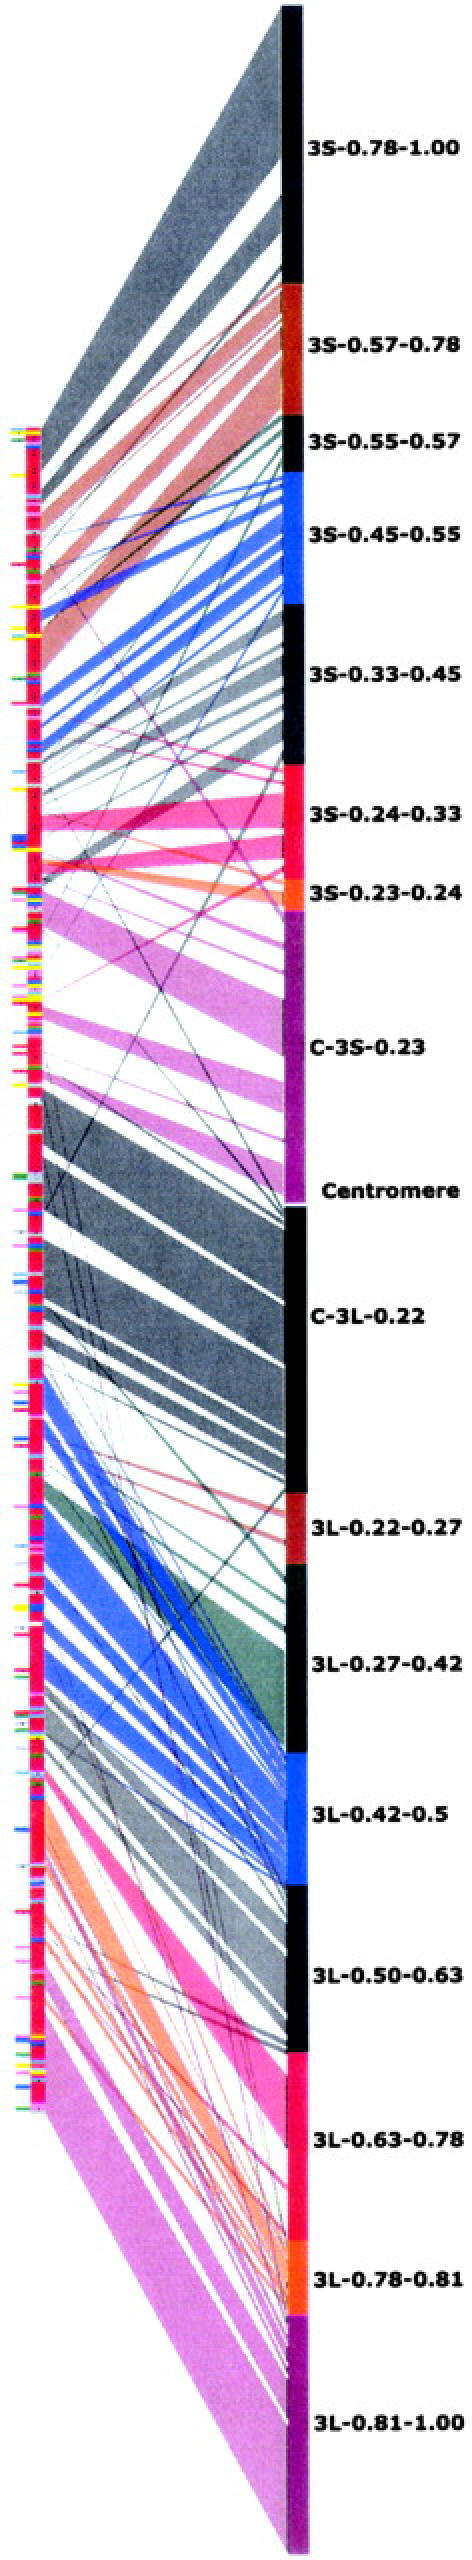
Depiction of the ordered rice chromosome 1 physical map (left) and correspondences with the wheat group 3 consensus chromosome bin map (right). The color coding corresponds to the blastN hits from the mapped wheat unigene set. The red coloring signifies a significant match to wheat group 3, whereas all other colors signify a best match to a different wheat chromosome group (Sorrells et al. 2003; La Rota and Sorrells 2004). The color coding is different for each bin within a chromosome arm but is repeated from the short arm to the long arm. Lines drawn between the rice and wheat group 3 maps show the relative location of each EST in rice and wheat. Thick sections represent a group of EST unigene blastN matches from the same consensus bin without interruption by one or more mapped-EST contig hits from a different consensus bin. Thin lines correspond to single wheat mapped-EST unigene blastN hits where the nearest neighbors are from different consensus bins. A more detailed figure is displayed in supplemental online material (http://wheat.pw.usda.gov/pubs/2004/Genetics).