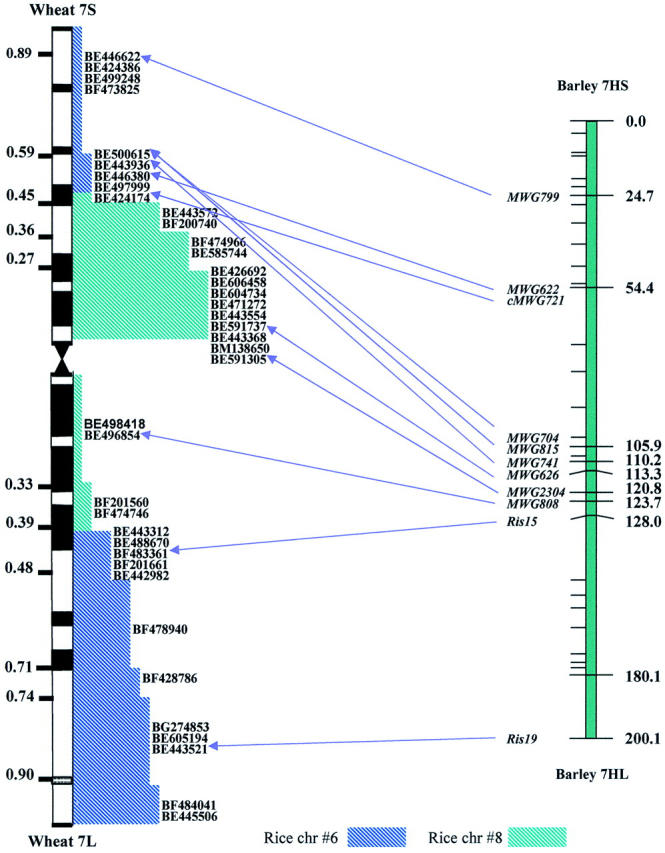
Figure 4.—

Comparison of map positions of molecular markers of rice and barley with tentatively ordered EST loci on the consensus map of homoeologous group 7. The linkage map of barley chromosome 7, adapted from Künzel et al. (2000), is depicted on the right. The stepwise increases in the height of the colored diagonal lines were used in wheat group 7 to differentiate among the regions.
