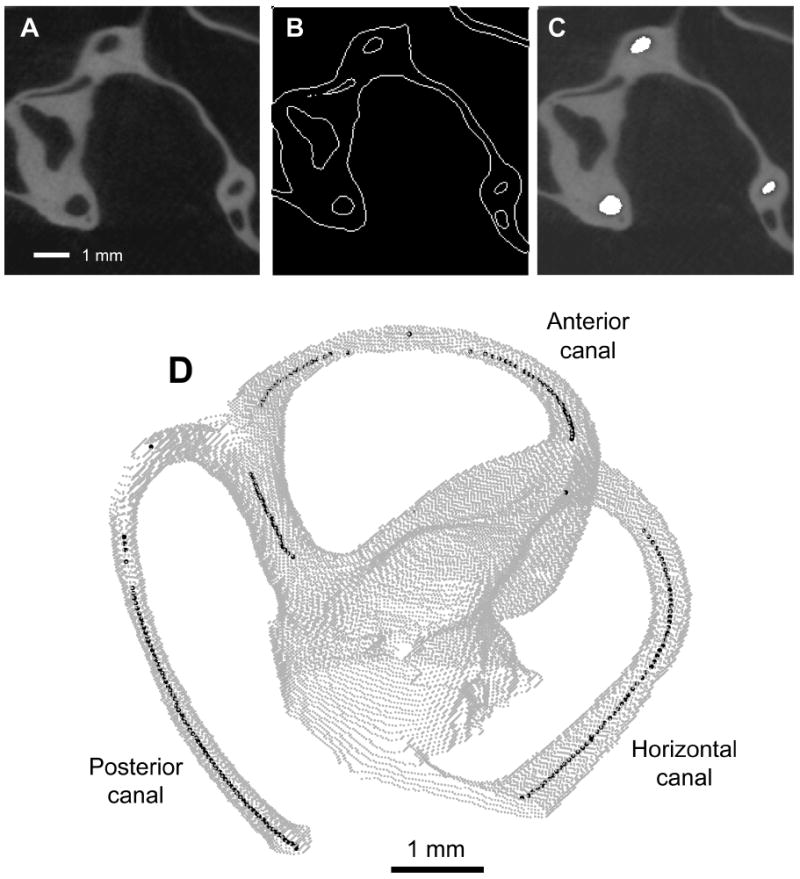
Fig. 1.

Canal planes determined using microCT technique. A: Raw microCT image of a portion of the chinchilla labyrinth in the axial plane, with semicircular canals and surrounding structures dark and neighboring bone bright. B: Bony edges of the same image have been determined and are represented by white lines. C: The areas representing the lumen of each semicircular canal have been determined and are filled in white. D: The outlines of the semicircular canals and nearby labyrinth from all the images in a data set are assembled here into a single volume (gray) with the centroids of each canal’s lumen represented by a black dot. In cases where the microCT image plane was tangent to the canal or when digitizing the bifurcation of the common crus, a reliable centroid could not be identified. These areas are represented by gaps in the line of black dots.
