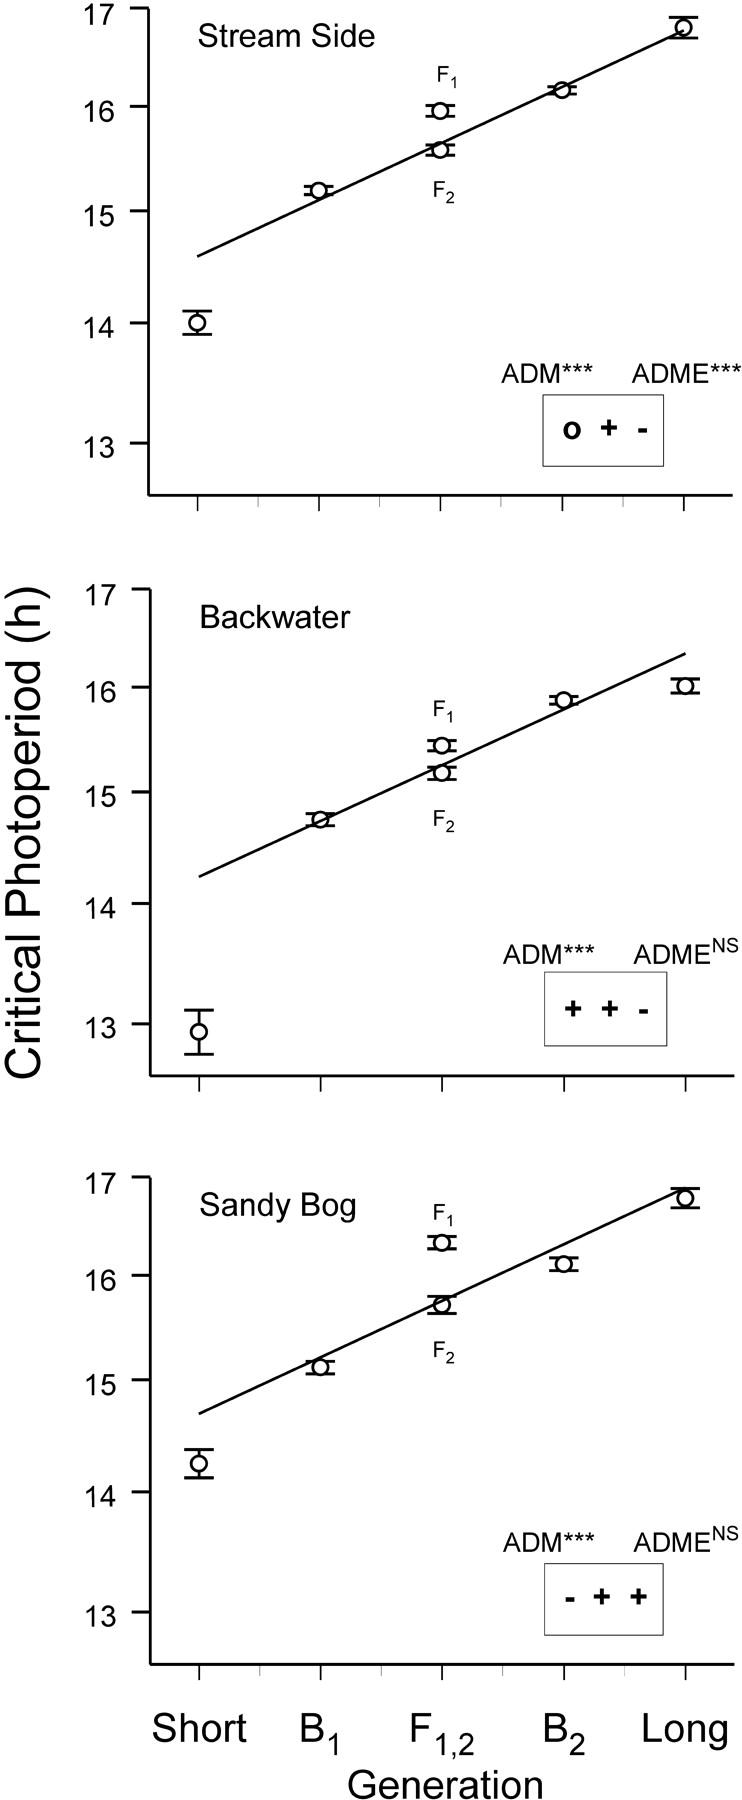
Figure 1.—

Critical photoperiod of long and short selected lines and their F1 and F2 hybrids and backcrosses (B1, B2). The plots show mean log10(critical photoperiod, hr ± 2SE). The solid line shows the weighted least-squares expectation of an additive model. The results of the joint-scaling test (see also Table 1) are shown for the additive-dominance-maternal (ADM) and the ADME models; ***P < 0.001; NSP > 0.05. The symbols in the boxes refer to the sign of digenic epistasis (+, significant and positive; −, significant and negative; 0, not significant) in the order A × A, A × D, D × D from the coefficients in Table 2.
