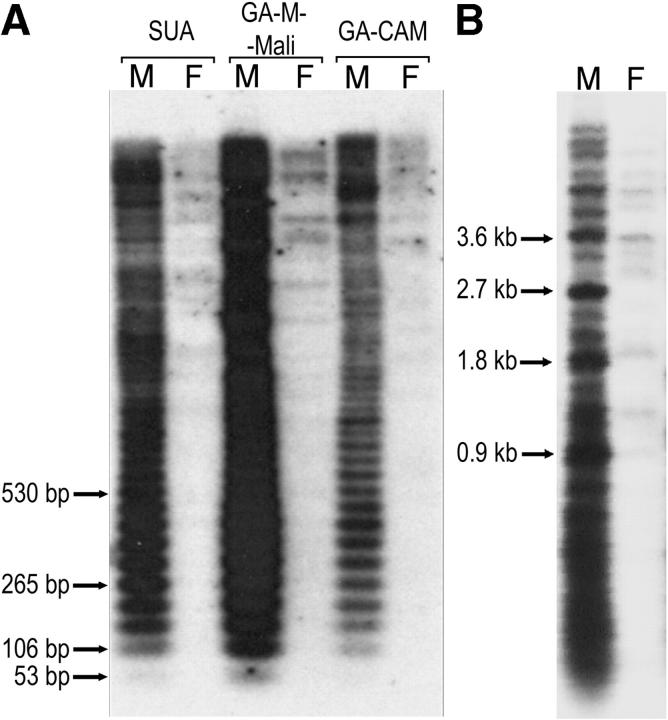
Figure 5.—
Southern blots of genomic DNA from A. gambiae resolved on a 1.5% agarose gel (A), or 0.8% agarose gel (B), and probed with the AgY53A satellite monomer. Arrows indicate bands corresponding to a monomer and selected oligomers (A) and those corresponding to the higher-order units (B); the respective fragment sizes are shown.

