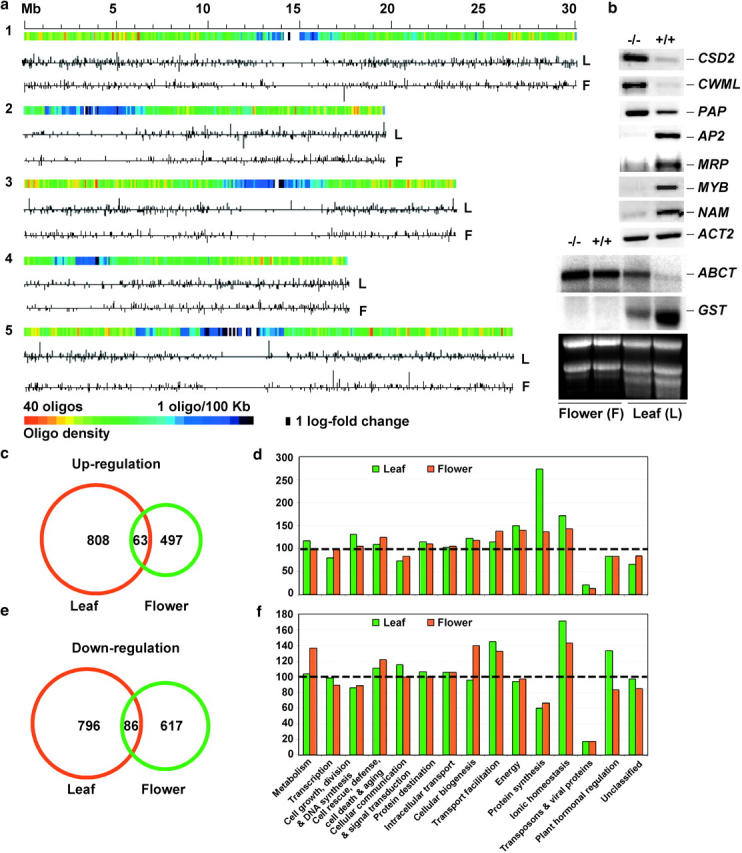
Figure 1.—

(a) Chromosomal distribution of differentially expressed genes in the athd1-t1 leaves (L) and flowers (F). The 70-mer oligos were mapped in five chromosomes using the annotated gene sequences correspondent to genomic coordinates, as shown in color gradients from high (red) to low (blue) gene density. The up- and downregulated genes in the athd1-t1 lines are indicated by the vertical lines above or below the horizontal line, respectively, the length of which is proportional to natural logarithm fold changes of gene expression between the athd1-t1 and Ws lines. (b) RT-PCR and Northern blot analyses of differentially expressed genes (supplementary Tables 3 and 4 at http://www.genetics.org/supplemental/) in leaves (L) and flowers (F) of Ws and athd1-t1 lines. (c) Only 4.6% of the upregulated genes detected in the leaves and flowers overlapped. (d) The relative ratio in the y-axis was calculated using the percentage of upregulated genes from each functional category detected in the athd1-t1 lines divided by the percentage of ∼26,000 annotated genes in the same category in the genome (Arabidopsis Genome Initiative 2000). The dashed line (at 100) indicates that the percentage of all annotated genes in this functional category is equal to the percentage of the genes that are upregulated in the athd1-1 lines. (e) Only 5.7% of the downregulated genes detected in the leaves and flowers overlapped. (f) The percentages of downregulated genes detected were analyzed using the same method as in d.
