
Figure 2.—

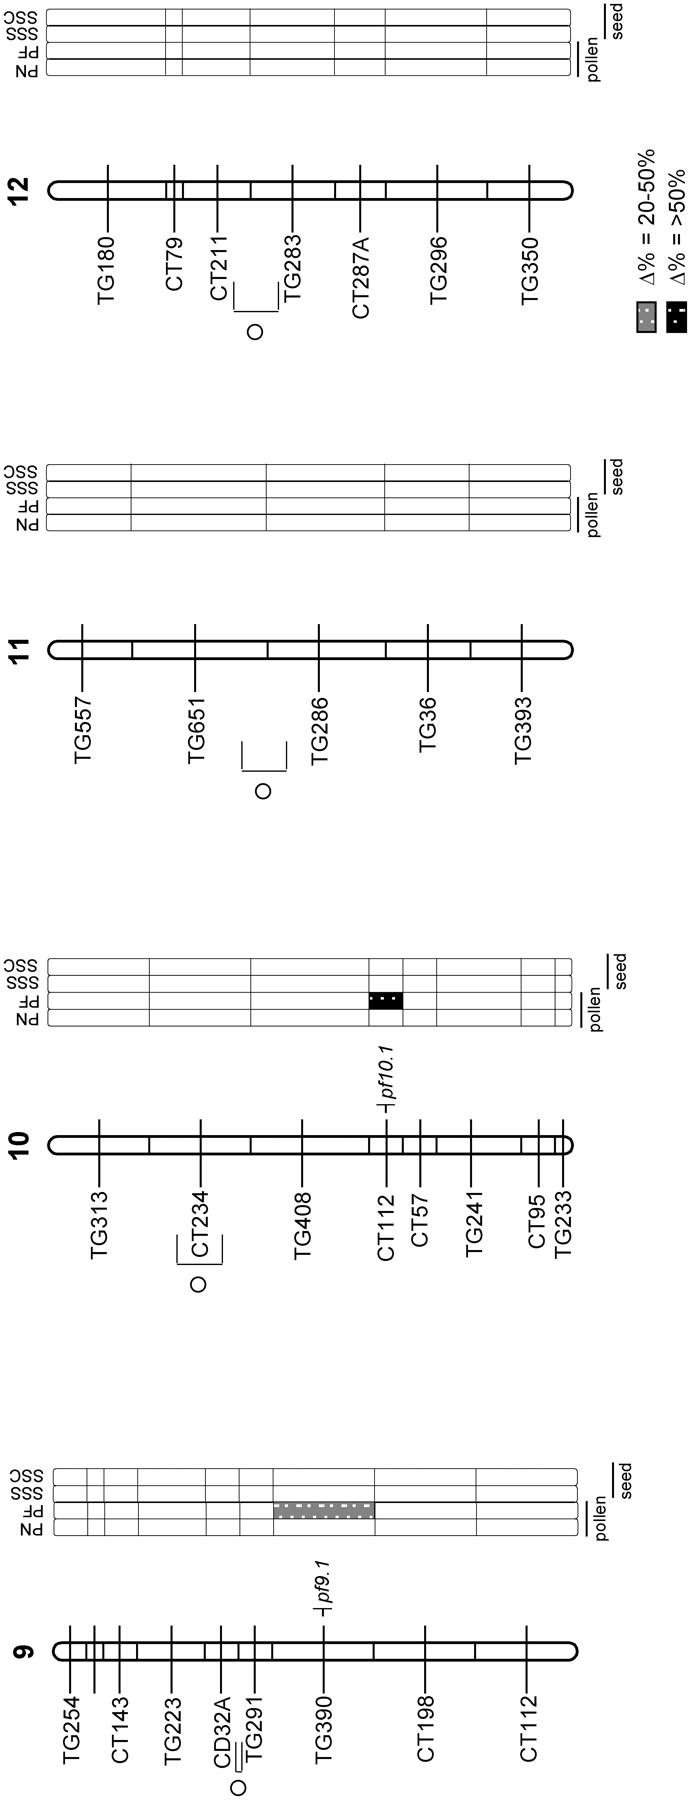
QTL for pollen and seed fertility traits, with their location on the L. esculentum × L. hirsutum linkage map. Hatched chromosomal regions on the linkage map indicate areas of the genome fixed for LE alleles (i.e., genomic regions not represented in the NIL population). The self-incompatibility (S) locus and self-pruning (sp) locus are indicated to the left of the chromosomes. The shaded bars to the right of the chromosomes show the individual analyses for the following traits: PN, total pollen count per flower; PF, proportion of fertile pollen per flower; SSS, self (homozygous) seed set; and SSC, LE-cross (heterozygous) seed set. Levels of percentage difference (Δ%) from the LE control parent for 20 > Δ < 50 and Δ > 50 are indicated by the intensity of shading (see key on figure). Putative QTL are indicated by symbols to the right of each chromosome, marked at the center of the chromosomal region showing a significant effect for the trait. Self-seed set traits in brackets are those that are nonsignificant once the effect of pollen fertility is removed statistically (see text).