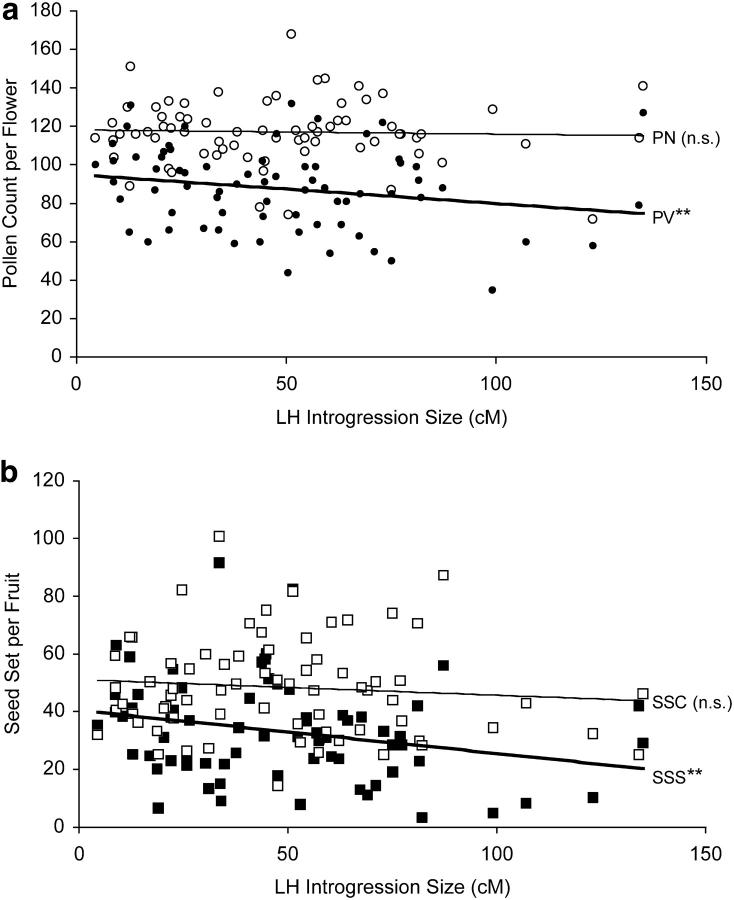
Figure 3.—
Relationships between the size of LH introgression (in centimorgans) and mean NIL (a) pollen or (b) seed fertility. (a) Pollen fertility measures shown are total pollen count per flower (PN; in open circles with thin line) and (for convenience of representation) number of viable pollen per flower (PV; in solid circles with thick line). (b) Seed fertility measures are LE-cross seed set per fruit (SSC; in open squares with thin line) and self-seed set per fruit (SSS; in solid squares with thick line). Double asterisks indicate significant negative regression at P < 0.001; NS, not significant. Note that regression results for proportion of fertile pollen (PF; arcsine square-root transformed) were equivalent to PV results.

