
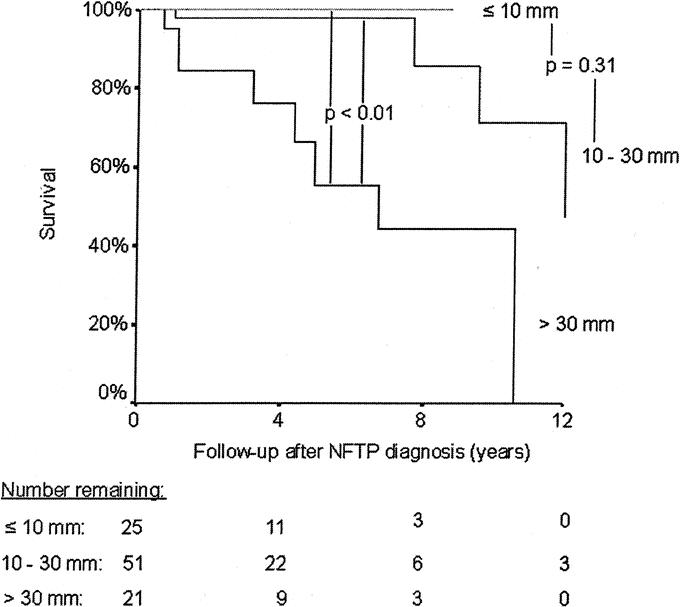
FIGURE 4. Kaplan-Meier representation of survival after NFTP diagnosis according to the size of the NFTP. The number of patients at risk at each time point is shown below the graph.
Official websites use .gov
A
.gov website belongs to an official
government organization in the United States.
Secure .gov websites use HTTPS
A lock (
) or https:// means you've safely
connected to the .gov website. Share sensitive
information only on official, secure websites.
FIGURE 4. Kaplan-Meier representation of survival after NFTP diagnosis according to the size of the NFTP. The number of patients at risk at each time point is shown below the graph.