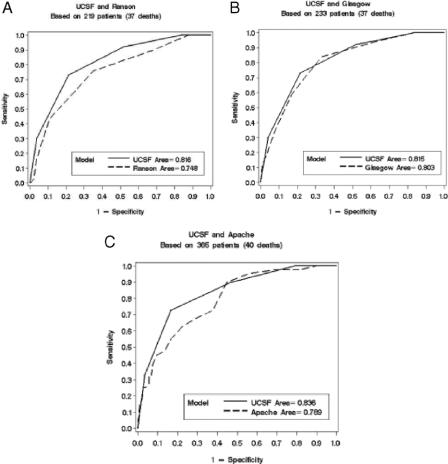
FIGURE 2. Receiver operating characteristic curves for BALI model versus the (A) Ranson, (B) Glasgow, and (C) APACHE II systems, respectively. y-axis = sensitivity; x-axis = 1 − specificity. Areas under the curves (AUC) for the BALI model were: ≥0.81 ± 0.03 versus 0.75 ± 0.04, a difference of 0.07 (CI, −0.15 to 0.01; P = 0.08) (Ranson), 0.80 ± 0.03; a difference of 0.01 (CI, −0.08 to 0.06; P = 0.72) (Glasgow), and 0.79 ± 0.03; a difference of 0.05 (CI, −0.12 to 0.03; P = 0.21) (APACHE II), respectively.

An official website of the United States government
Here's how you know
Official websites use .gov
A
.gov website belongs to an official
government organization in the United States.
Secure .gov websites use HTTPS
A lock (
) or https:// means you've safely
connected to the .gov website. Share sensitive
information only on official, secure websites.
