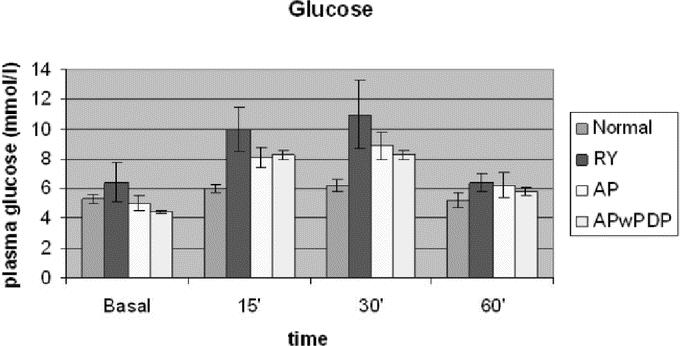
FIGURE 2. Basal and stimulated plasma glucose levels in Roux-en-Y, AP, and APwPDP patients and in normal controls. Curves differed significantly by factorial ANOVA (P = 0.002). Post hoc test showed Roux-en-Y versus normal (P = 0.025) and Roux-en-Y versus AP (P = 0.044).
