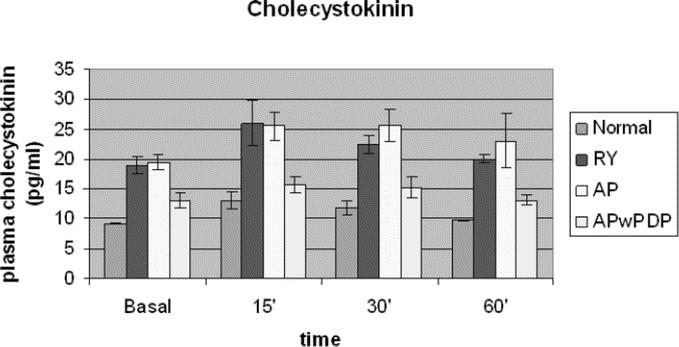
FIGURE 4. Basal and stimulated plasma cholecystokinin levels in Roux-en-Y, AP, and APwPDP patients and in normal controls. Curves differed significantly by factorial ANOVA (P < 0.001). Post hoc test showed normal versus Roux-en-Y (P < 0.001), normal versus AP (P < 0.001), normal versus APwPDP (P = 0.003), Roux-en-Y versus APwPDP (P < 0.001), and AP versus APwPDP (P < 0.001).
