
FIG. 4.
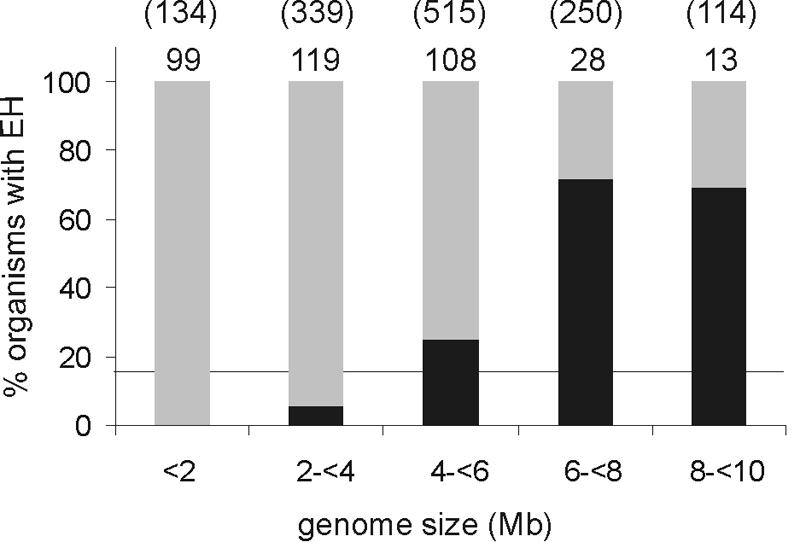
Occurrence of putative epoxide hydrolases in prokaryotes and archaea in relation to genome size. The number of organisms with a given genome size is indicated above each percentage bar, with the size of the collective genomes in this category shown in parentheses (in Mb). The percentages of organisms that have at least one putative epoxide hydrolase are indicated in black. The horizontal line indicates the average number of epoxide hydrolase-containing organisms (17.5%).