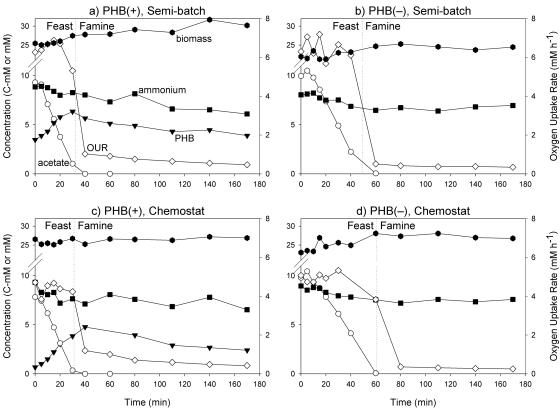
FIG. 1.
Concentrations of acetate (mmol C/liter) (○), PHB (mmol C/liter) (▾), ammonium (mmol/liter) (▪), and biomass (mmol C/liter) ( ) (left axis) and oxygen uptake rates (mmol/liter · h) (⋄) (right axis) during a pulse experiment. (a) PHB(+) in a semibatch reactor. (b) PHB(−) in a semibatch reactor. (c) PHB(+) in a chemostat reactor. (d) PHB(−) in a chemostat reactor. Note that the left y axes are broken between 12 and 21 mM.

