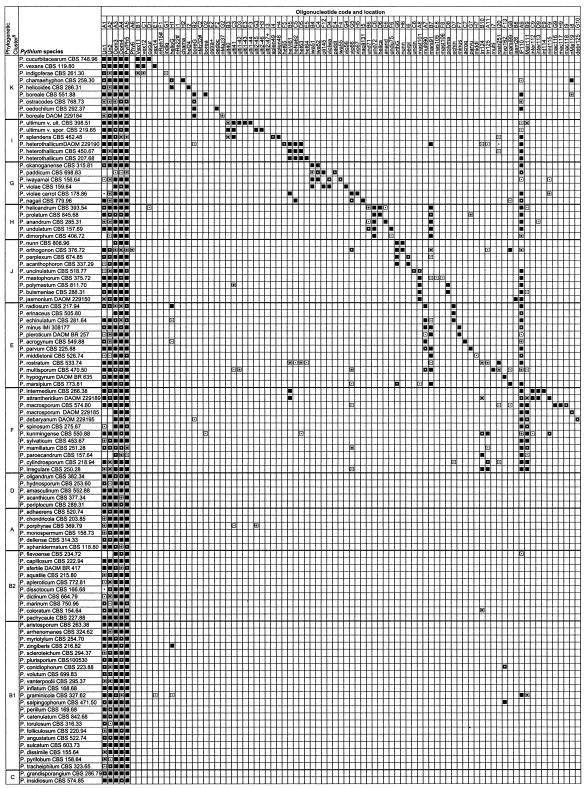
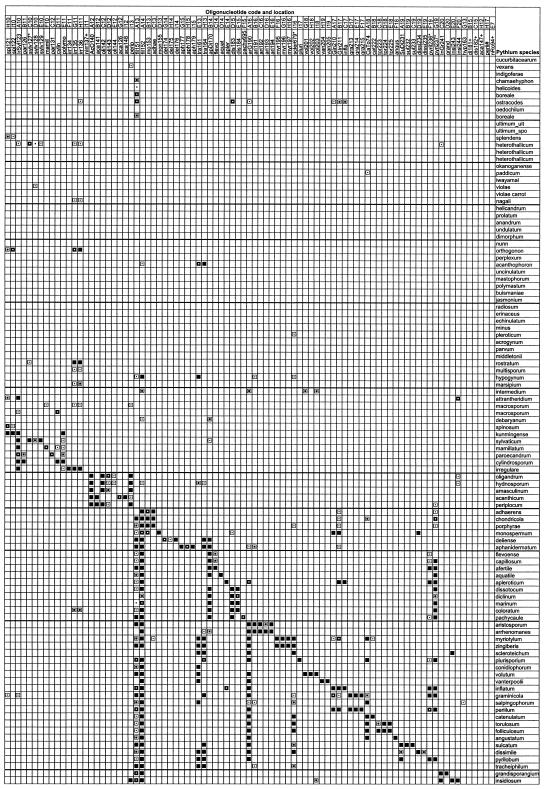
FIG.1.
Summary of hybridization patterns of digoxigenin-labeled PCR amplicons of Pythium species to an array of species- and group-specific oligonucleotides on nylon membranes. Chemiluminograms were scanned on a 16-bit gray scale with Fotolook Ps 2.08 software on an ARCUS II scanner, and gray scale values of each dark spot, computed with GenePix Pro 3.0.6 (AXON Instruments, Inc., Calif.), are indicated by the following symbols: □, <500 (not detected); ▪, 501 to 1,000; ⊡, 1,001 to 10,000;  , 10,001 to 20,000;
  , 20,001 to 30,000; ▪, 30,001 to 65,000 (maximum reaction signal). The locations of the oligonucleotides given at the top correspond to their locations on the membranes in the array. Oligonucleotides are presented in Table 1. Symbols: §, phylogenetic clusters as described by Lévesque and de Cock (25); *, oligonucleotides that exhibited cross-hybridization with nontarget Pythium species; +, oligonucleotides that did not produce detectable signals; #, oligonucleotides from potential new species that were spotted but not hybridized with corresponding digoxigenin-labeled DNA.


