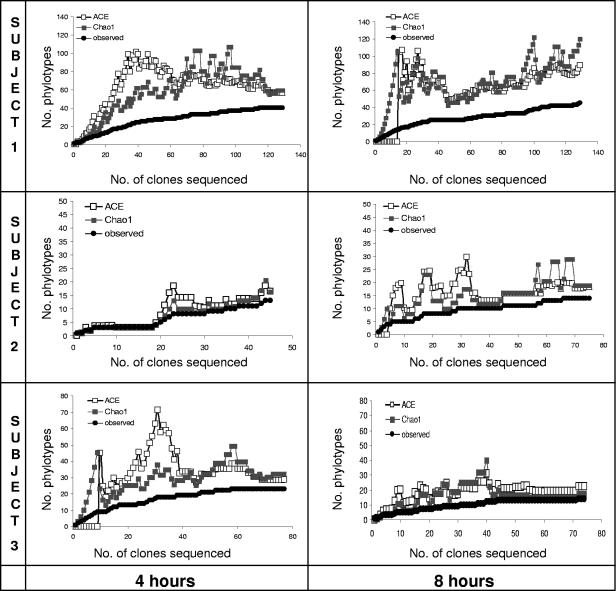
FIG. 2.
Collector's curves of observed and estimated (ACE and Chao1) phylotype richness as a function of the number of clones. These curves depict the change in richness values as the number of clones in the library increased and are used to assess the sufficiency of the sampling effort for each specific library. A sufficient number of clones was sequenced in all libraries except in the 8-h library from subject 1, in which the gap between the observed and estimated phylotype curves had not closed when sampling stopped.

