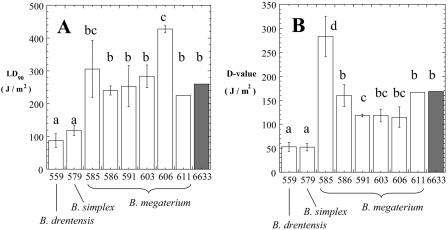
FIG. 5.
Spore UV resistance. The graphs show comparisons of LD90 values (A) and D values (B) of granite isolates (white bars) (numbers denote strain numbers; see Table 1) and the UV dosimetry strain B. subtilis ATCC 6633 (6633; shaded bars). Bars and error bars represent averages and standard deviations, respectively (n = 3 or 4). Strains with P values of <0.05 by analysis of variance were judged as belonging to separate groups (indicated with lowercase letters).

