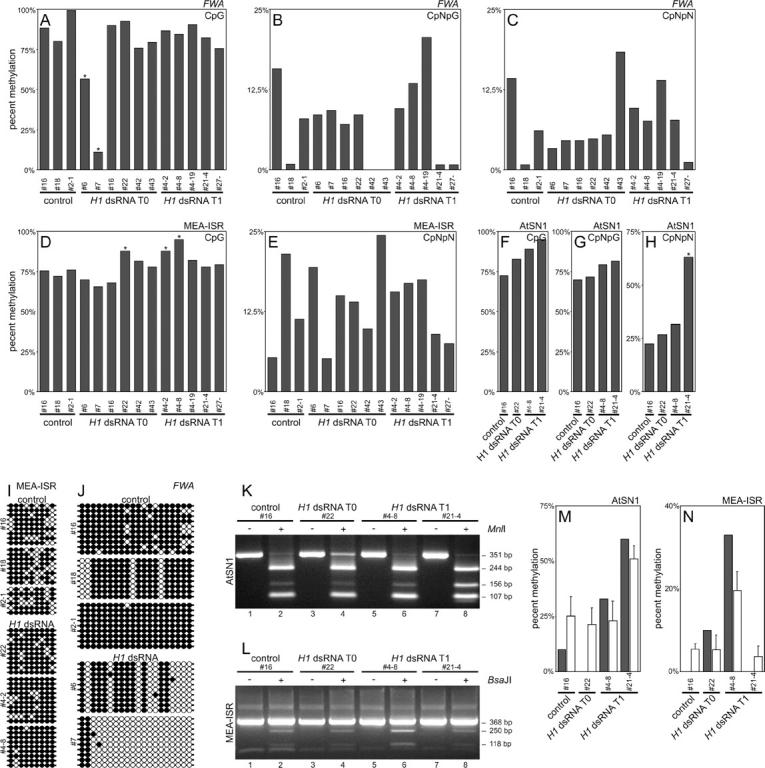
Figure 7.—

Genomic bisulfite sequencing of the FWA promoter, MEA-ISR, and AtSN1. (A) At the FWA promoter there was significant reduction of CpG methylation in two plants with reduced expression of H1 (plants 6 and 7). Asterisk indicates statistical significance. (B and C) CpNpG and asymmetric (CpNpN) methylation of the FWA promoter is highly variable even in control plants. (D) At the MEA-ISR sequence there was a small but significant increase in CpG methylation in three plants with reduced expression of H1 (22, 4-2, and 4-8). Asterisk indicates statistical significance. (E) Asymmetric methylation of MEA-ISR is highly variable even in control plants. (F–H) At the AtSN1 retrotransposon locus some increase in CpG and asymmetric methylation was detected, which was statistically significant for one plant (21-4). (I) CpG methylation of cytosines in individual clones in MEA-ISR. Solid circles indicate methylated and open circles indicate nonmethylated cytosines. (J) CpG methylation of cytosines in the FWA promoter in individual clones. Solid circles indicate methylated and open circles indicate nonmethylated cytosines. (K) Verification of bisulfite sequencing of AtSN1 locus with MnlI digestion. The 351-bp band represents the uncleaved PCR fragment, the 244- and 107-bp bands indicate digestion at a site that has no cytosines on the converted strand and thus is always cleaved, and the 156-bp band (plus an additional 88-bp band not visible on 3% agarose gel) indicates digestion of the second site and thus methylation of all cytosines in the CCTC restriction site. (L) Verification of bisulfite sequencing of MEA-ISR with BsaJI digestion. The 368-bp band represents an uncleaved PCR fragment, the 250- and 118-bp bands indicate digestion and thus methylation of both cytosines in the CCNNGG restriction site. (M and N) Comparison of digestion rate (open bars represent the average from three independent digestions; error bars represent SD) with bisulfite sequencing data for cytosines recognized by the restriction enzyme (solid bars). For both AtSN1 and MEA-ISR, sequencing and digestion data are in agreement. Annotation of plants as described for Figure 3. Plant 4-2 is transgenic with normal phenotype, plant 4-8 is transgenic with changed phenotype, and plant 4-19 is nontransgenic with changed phenotype.
