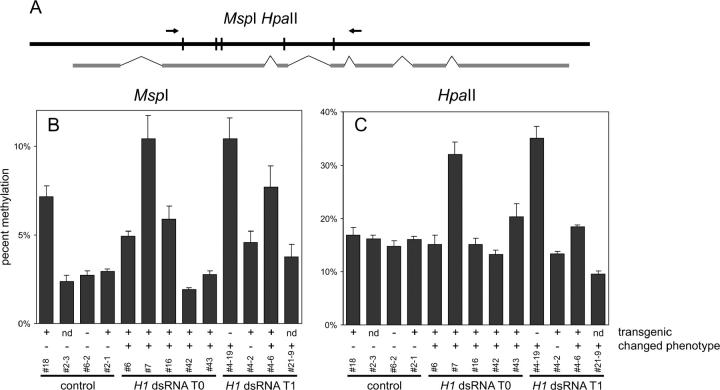
Figure 8.—
DNA methylation of At3g45140. (A) Diagram of the analyzed sequence with PCR primers and relevant restriction sites of MspI/HpaII as well as exon/intron organization of the locus marked. (B) Densitometric analysis of the results of MspI digestion (20× overdigestion; the average from three independent amplifications; error bars represent SD) showing CpNpG methylation; primers flanked five digestion sites. A primer pair for locus At3g55440 flanking a sequence with no cleavage sites for MspI and HpaII was used as a control. Methylation is significantly increased in two plants with H1 suppression (7 and 4-19). (C) Densitometric analysis of the results of HpaII digestion (20× overdigestion; average from three independent amplifications; error bars represent SD) showing CpG and CpNpG methylation; primers flanked five digestion sites. The primer pair for locus At3g55440 was used as a control. Methylation is significantly increased in two plants with H1 suppression (7 and 4-19). Annotation of plants as well as indication of phenotype and transgene presence as described for Figure 3.

