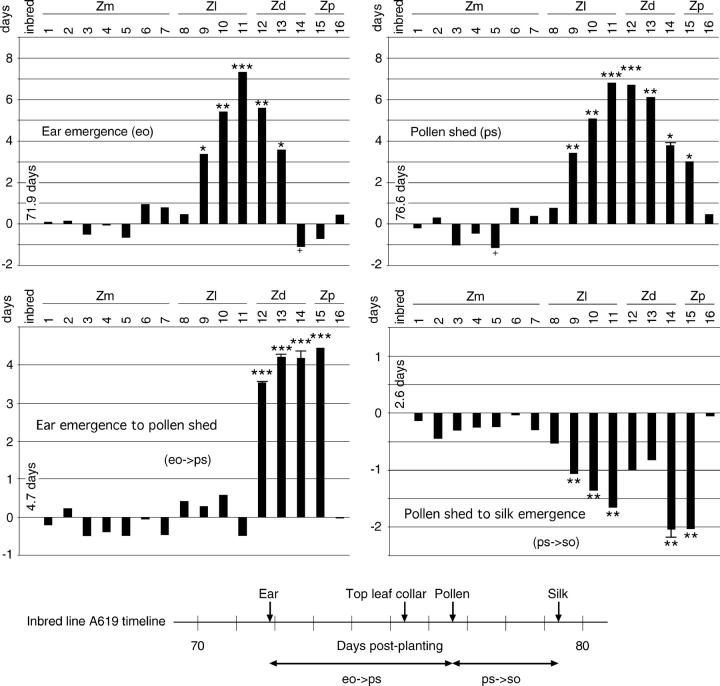
Figure 4.—
Difference from the inbred line to two developmental milestones in two times separating developmental milestones (in days). The developmental time line for the reference inbred line is shown at the bottom. Scales are not all the same. Standard error bars are included where they are large enough to be seen. See Figure 3 for general information.

