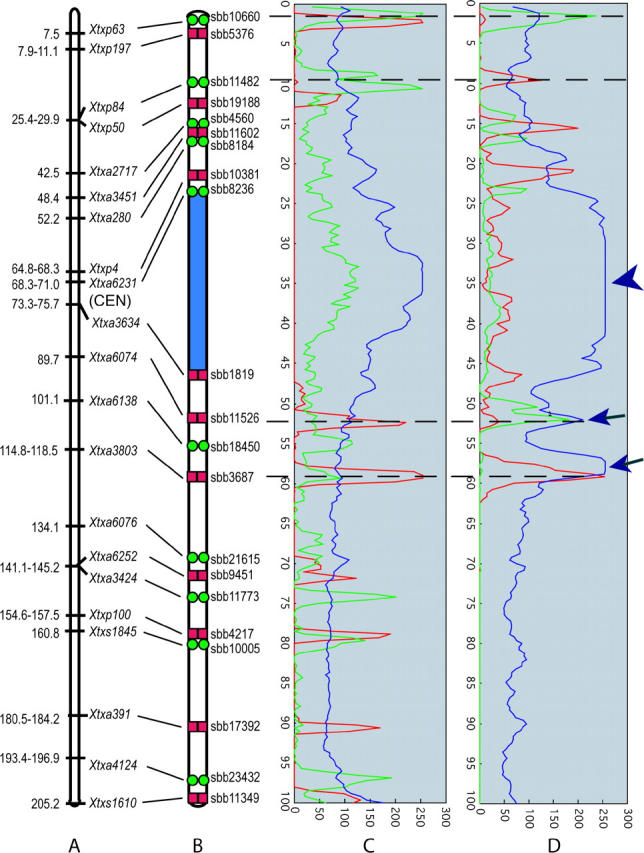
Figure 4.—

A diagrammatic representation of the cytogenetic locations of 21 sorghum BACs on sorghum LG-02 and the corresponding marker positions (Menz et al. 2002). (A) Linkage group 2 markers used to select BACs for FISH (Menz et al. 2002). (B) Diagram of LG-02 pachytene bivalent indicating the positions of signals from BACs that contain LG-02 marker loci. Green circles, FITC detection; red boxes, Cy3 detection. Signals were located on the basis of the positions of signal peaks from Figure 3. (C and D) Estimation of the strength and location of BAC probes (C for Figure 2 and D for Figure 3). Graph peaks represent relative strengths of fluorescence signals and their distributions; blue represents 4′,6-diamidino-2-phenylindole (DAPI) signal from chromosomal DNA, green represents FITC signal, and red represents Cy3 signal. Dashed lines spanning C and D indicate peaks for probes common to both BAC-FISH cocktails. Arrowhead indicates saturated signal from DAPI and arrows indicate signals of DAPI from overlapping strands of the pachytene bivalents.
