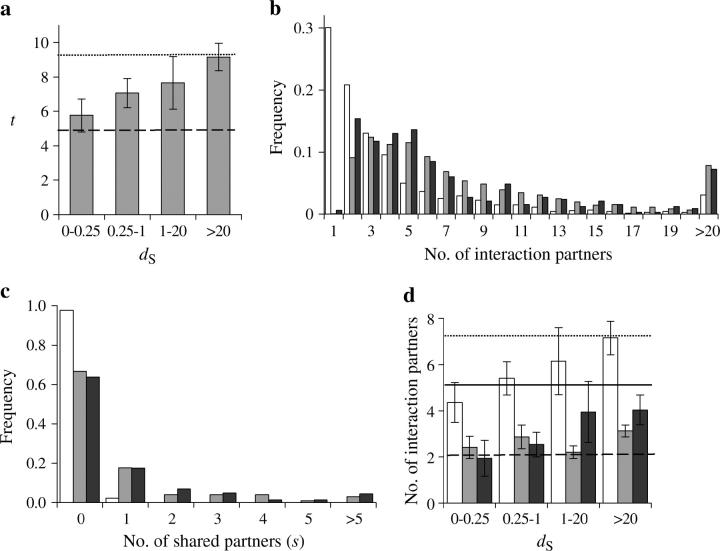
Figure 2.—
Number of protein interaction partners of yeast duplicate and singleton genes. (a) Mean number of partners (t) for duplicate pairs with different dS. The error bar shows one standard error of the mean. The dashed line shows the average number of partners per singleton (A) and the dotted line shows the average number per random pair of singletons (T). There are 17, 15, 70, and 229 duplicate pairs in the four bins, respectively. (b) Frequency distributions of the number of interaction partners for singletons (open bars), singleton pairs (shaded bars), and duplicates (solid bars). (c) Frequency distributions of the number of shared partners between singleton pairs (open bars), duplicates with dS < 20 (shaded bars), and duplicates with dS > 20 (solid bars). (d) Difference in the number of partners between duplicates. The mean max(a1, a2), min(a1, a2), and δ = |a1 − a2| for duplicates are shown in open, shaded, and solid bars, respectively, with their corresponding mean values from random singleton pairs shown by the dotted, dashed, and solid lines, respectively. For any given pair of duplicates, a1 and a2 are the numbers of partners that they each have.

