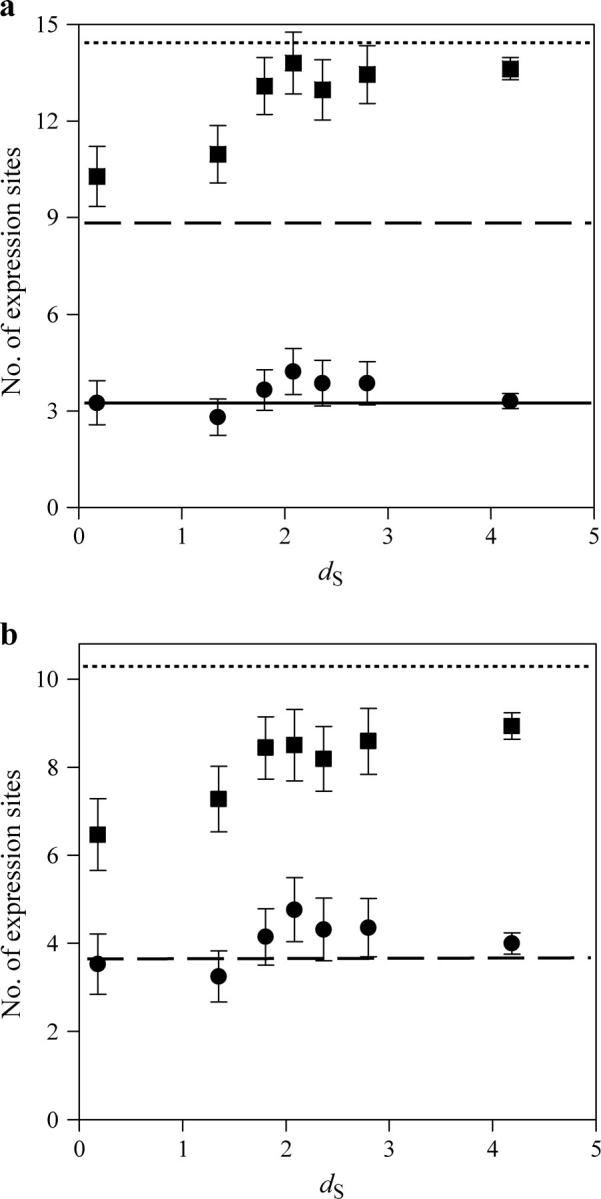
Figure 3.—

Number of expression sites of human duplicate and singleton genes. (a) Mean number of expression sites (t, squares) and mean number of shared expression sites (s, circles) for duplicate pairs with different dS. The 1230 duplicate gene pairs are ranked by their dS. Each square (or circle) represents the median dS and mean t (or mean s) for 100 gene pairs, with the exception of the last square (or circle), which is derived from 630 gene pairs. The error bar shows one standard error of the mean. The dashed line shows the average number of expression sites per singleton (A) and the dotted line shows the average number per random pair of singletons (T). The solid line shows the average number of shared expression sites per random pair of singletons. (b) Difference in the number of expression sites between duplicates. The mean δ = |a1 − a2| and min(a1, a2) for duplicates are shown in squares and circles, respectively, with their corresponding mean values from singleton pairs shown by the dotted and dashed lines, respectively. For any given pair of duplicates, a1 and a2 are the numbers of expression sites that they each have.
