Figure 2.—
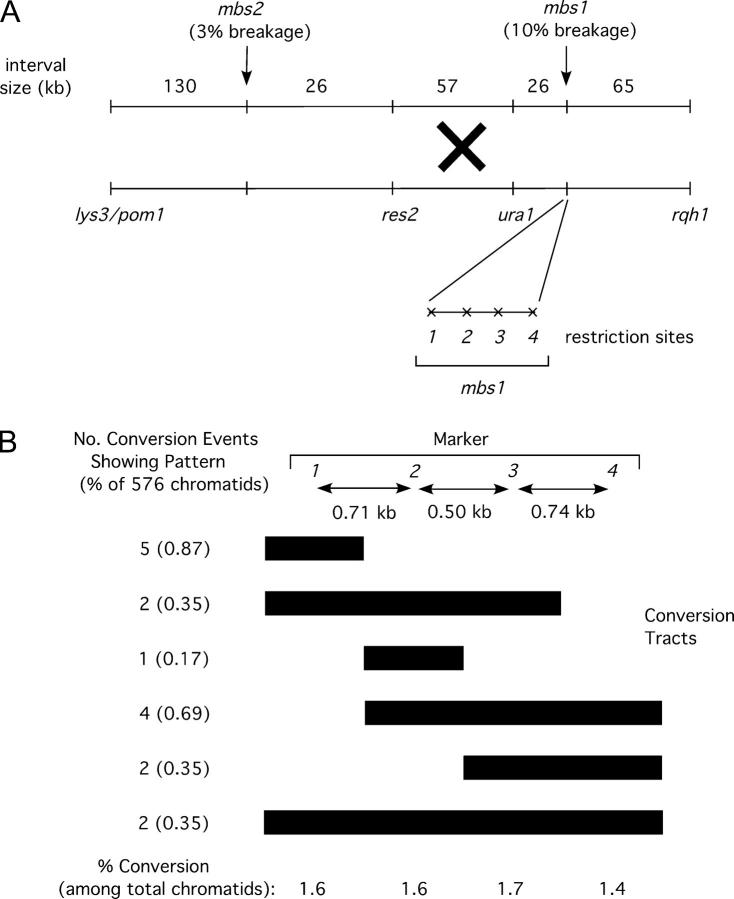
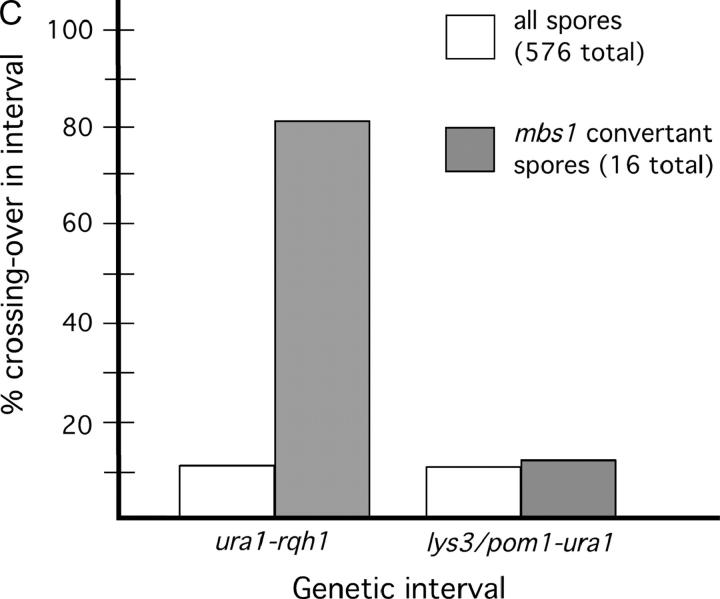
The mbs1 locus is a hotspot for gene conversion, highly associated with ura1-rqh1 crossovers. (A) Map of mbs1 and surrounding region showing markers used to measure crossover frequencies and the four restriction sites used to monitor gene conversion at mbs1. The physical sizes of the genetic intervals are shown along with observed meiotic break frequencies at sites mbs1 and mbs2. The restriction sites (1–4) in Figure 1C were scored by PCR and restriction. (B) Conversion patterns of markers 1–4 observed at mbs1 from 144 tetrads. Tetrads from two crosses (cross A—GP3696 × GP3731, 94 tetrads; cross B—GP3410 × GP5145, 50 tetrads) were scored for restriction sites to identify conversion frequency and distribution (see supplemental Figure 1 at http://www.genetics.org/supplemental/). Ten conversion tetrads were identified in cross A (including one apparent double-conversion tetrad) and five in cross B. Bars extend under the markers converted; endpoints are arbitrarily placed at midpoints between the markers scored. (C) Crossovers in the interval ura1-rqh1, but not in the interval lys3/pom1-ura1, are associated with mbs1 conversions. The frequencies of crossovers in the intervals lys3/pom1-ura1 and ura1-rqh1 are shown among total spores and among mbs1 conversion spores. The marker lys3 was used in cross A and the marker pom1 in cross B; these markers are only ∼4 kb apart but are ∼210 kb from ura1 so the data for the crosses were pooled.


