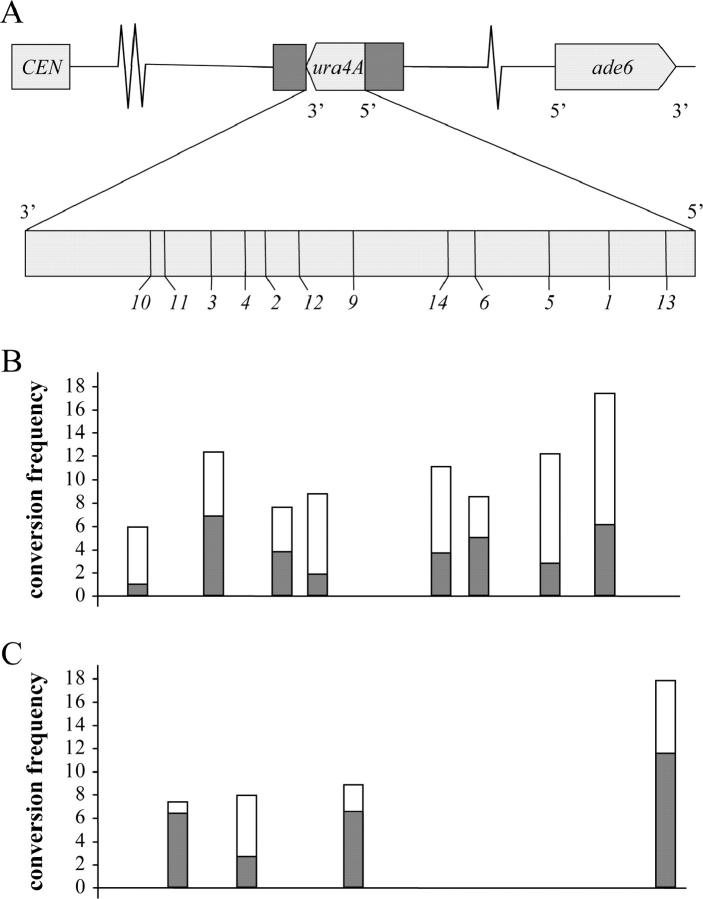
Figure 1.—
The ura4A hot spot. (A, top) The location and orientation of the ura4A insertion on chromosome III. (A, bottom) The locations of the sequenced mutations in the open reading frame (see Table 2 for details). In B and C, a gradient of conversion frequencies (percentage of NMS of tetrads examined) is apparent with the high frequencies for the mutations at the 5′ end. (B) Tetrad analysis of type I crosses (h+ ura4A+ × h− ura4A−) yielded overall more 2:6 (open bars) than 6:2 conversions (shaded bars). (C) Type II crosses (h− ura4A+ × h+ ura4A−) yielded more 6:2 than 2:6 conversions. For further explanations see the text.

