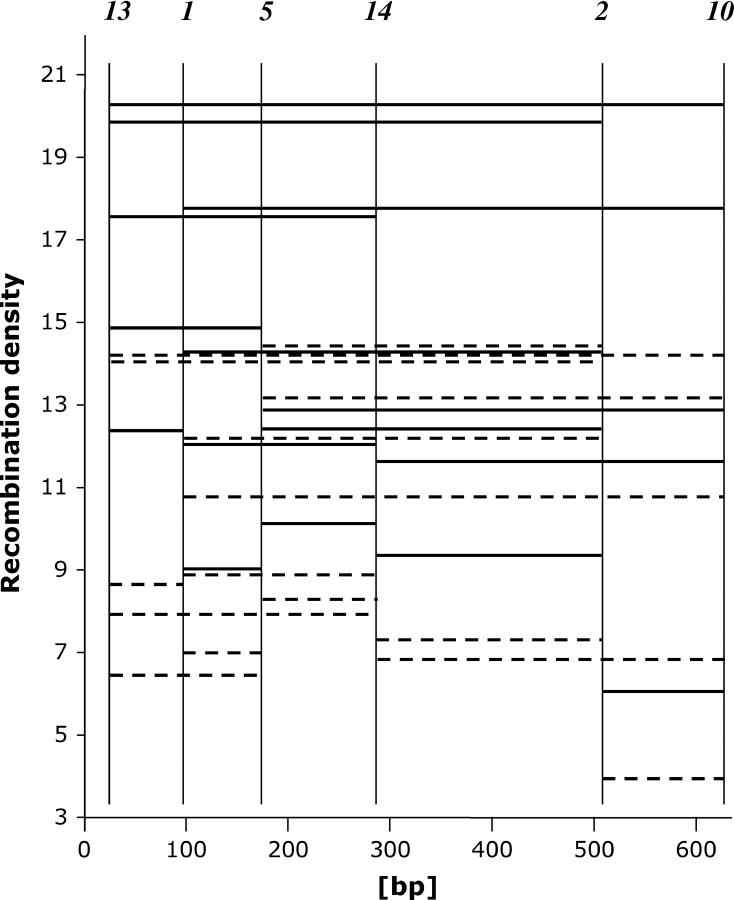
Figure 2.—
Intragenic two-factor crosses at ura4A. The abscissa shows the open reading frame of ura4A (5′ end to the left) and the physical position of six selected mutations. The ordinate portrays the recombination density D (ppm per base pair). The horizontal lines connect the two mutations involved in a given cross. Type III crosses show lower densities (dashed lines) than the corresponding type IV crosses (solid lines). The detailed data are shown in Table 3. For further explanations, see the text.

