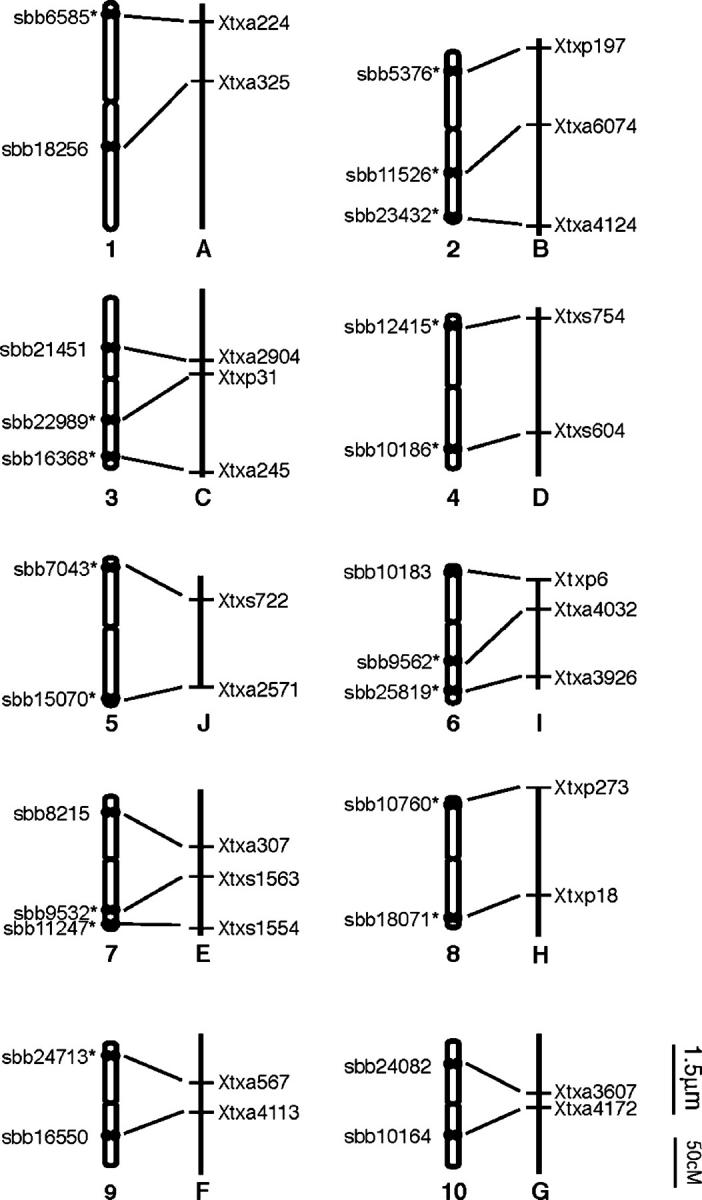
Figure 2.—

Correlation between mitotic metaphase chromosomes and linkage groups of sorghum using the map of Menz et al. (2002). Asterisks denote signals from the 17 BACs shown in Figure 1. Chromosomes are numbered according to size and linkage groups are labeled alphabetically. Chromosomes are depicted with the shorter arm in the top position. BAC clones are positioned on the ideogram according to their positions relative to the centromeres. Bar indicates 1.5 μm for metaphase chromosomes and 50 cM for linkage maps.
