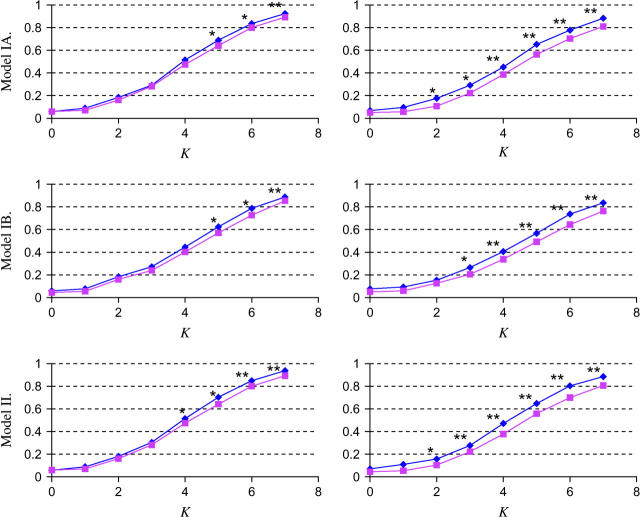
Figure 3.—
Power estimation and comparison of the EM-LRT and ANOVA F-test when P(A → a) = 20%. The points plotted indicate the empirical proportion of tests (by use of a nominal level α = 0.05) that rejected the H0 among 1000 simulated data sets. K = Δ/σ/ . Plots on the left correspond to cases with 10% missing data. Plots on the right correspond to cases with 20% missing data. * indicates cases where P < 0.05, and ** indicates cases where P < 0.005. Here “P” refers to the P-value of Wilcoxon rank-sum tests comparing the power difference between the EM-LRT and the F-test. Solid diamonds denote the power of the EM-LRT; solid squares denote the power of the ANOVA F-test.

