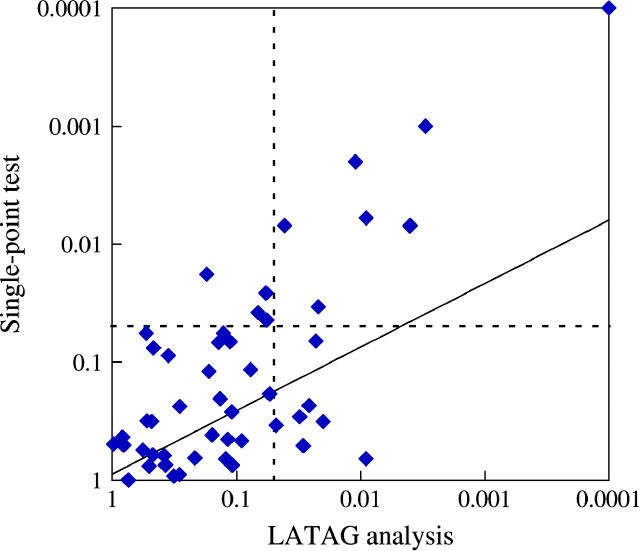
Figure 8.—
Comparison of the ability of LATAG (x-axis) and a SNP-based χ2-test (y-axis) to detect disease-causing loci in a test for association. Each point corresponds to one of the 50 simulated data sets and plots the most significant P-values obtained for that data set using each method, corrected for multiple testing within the region. The dotted lines depict the P = 0.05 cutoffs and the diagonal line plots the regression line through the log-log-transformed data.

