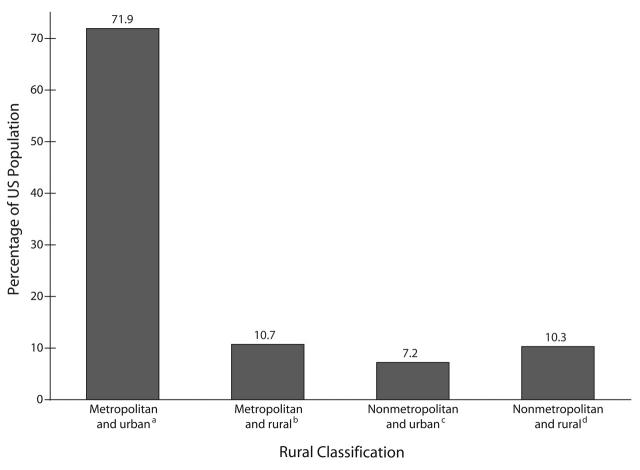
FIGURE 1—
Comparison of metropolitan and nonmetropolitan classifications with urban and rural classifications, by proportion of 2000 US population (N = 281 421 898): 2000 Census Bureau data.
Note. “Metropolitan” and “nonmetropolitan” are Office of Management and Budget terminology; “urban” and “rural” are Census Bureau terminology.
an = 202 000 000.
bn = 30 000 000.
cn = 20 000 000.
dn = 29 000 000.

