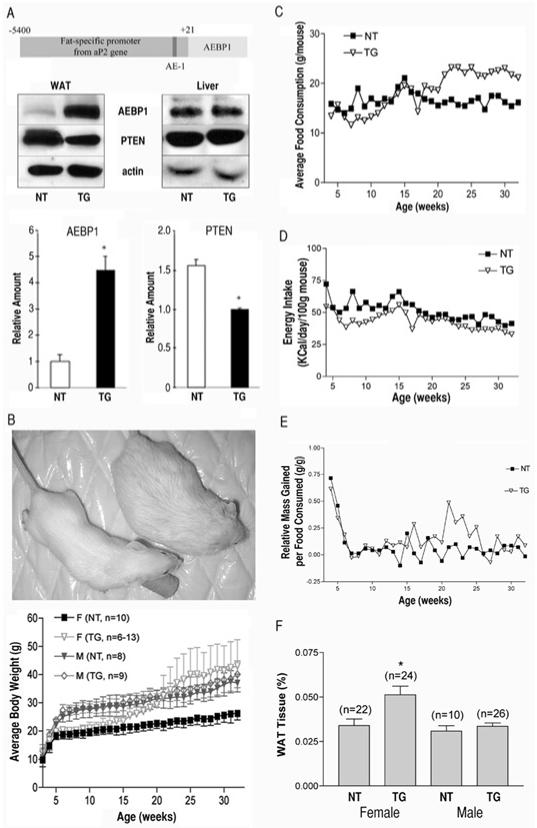
Figure 1.
Transgenic overexpression of AEBP1 in adipose tissue results in decreased expression of PTEN and increased adiposity in females on HFD. (A) Schematic representation of the fat-specific AEBP1 transgene. Expression of AEBP1 and PTEN were examined by immunoblotting with anti-AEBP1 or anti-PTEN antibody in the transgenic (TG) and nontransgenic (NT) littermates (32 weeks). Liver samples are shown as a control. Actin was used as a loading control. The average values of AEBP1 and PTEN expression in WAT from TG (n = 7) and NT (n = 6) mice are represented as the mean ± SD. *P < 0.0001. (B) Growth patterns of TG and NT mice on HFD. Each data point represents the mean ± SD of at least 6 mice. (C) Total food consumption per group in a cage was measured. Each data point represents the mean value per mouse. (D) Total energy intake per group in a cage was calculated. Each data point represents the mean value per 100 grams body weight. (E) Average feed efficiency was calculated with the mean value of weight gain in panel B and the mean value of food consumption in panel C. (F) The average values of total WAT (gonadal and visceral) in TG and NT mice fed on HFD. Each bar represents the mean ± SEM of the percent body weights. *P < 0.01 compared with female NT mice.

