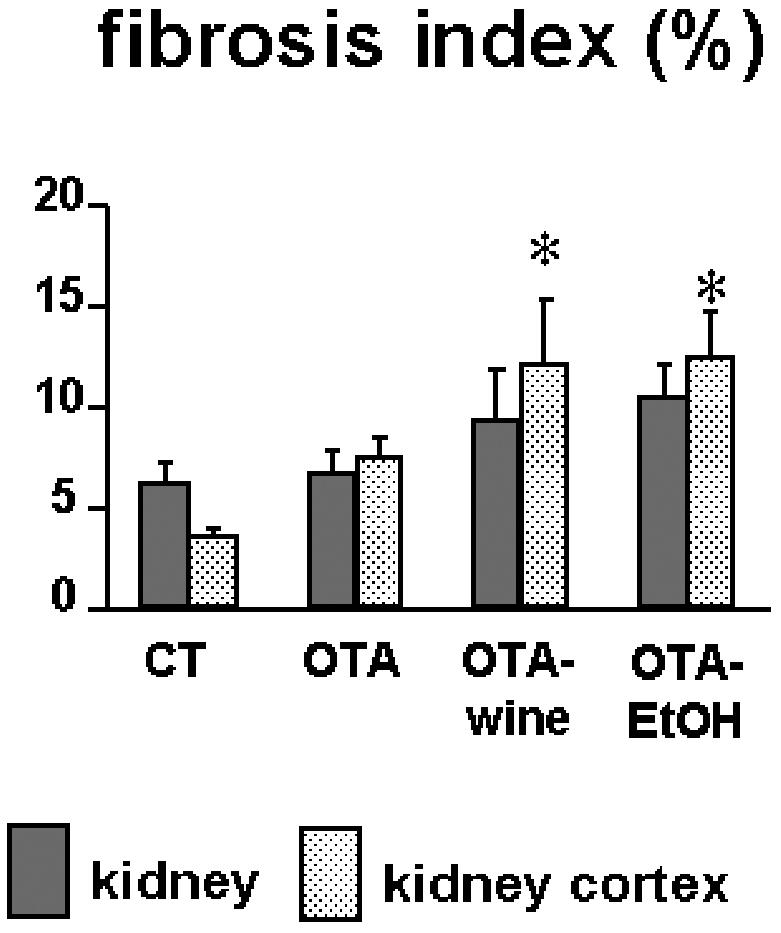
Figure 2.

Bar graphs showing the fibrosis index obtained by computerized analysis of kidney sections of CT, OTA, OTA-wine, and OTA-EtOH treated rats. The index indicates tissue collagen content and is calculated as described in “Materials and Methods.” Means ± SEM. *P < 0.05 compared with CT renal cortex.
