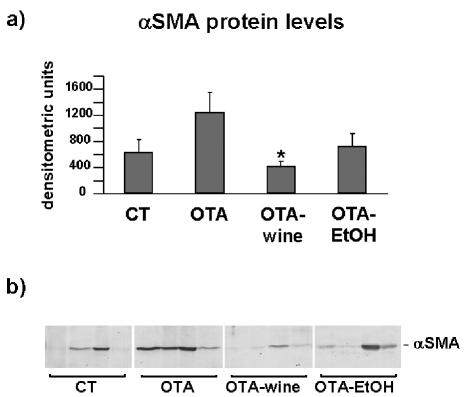
Figure 8.
(a) Bar graph showing αSMA protein levels after densitometric analysis of immunoreactive obtained by western blot (means ± SEM). (b) Representative Western blot of αSMA in kidney cortex homogenates of CT, OTA, OTA-wine, and OTA-EtOH treated rats. The immunoreactive band is αSMA. Each lane represents a single rat. *P < 0.05 compared with OTA.

