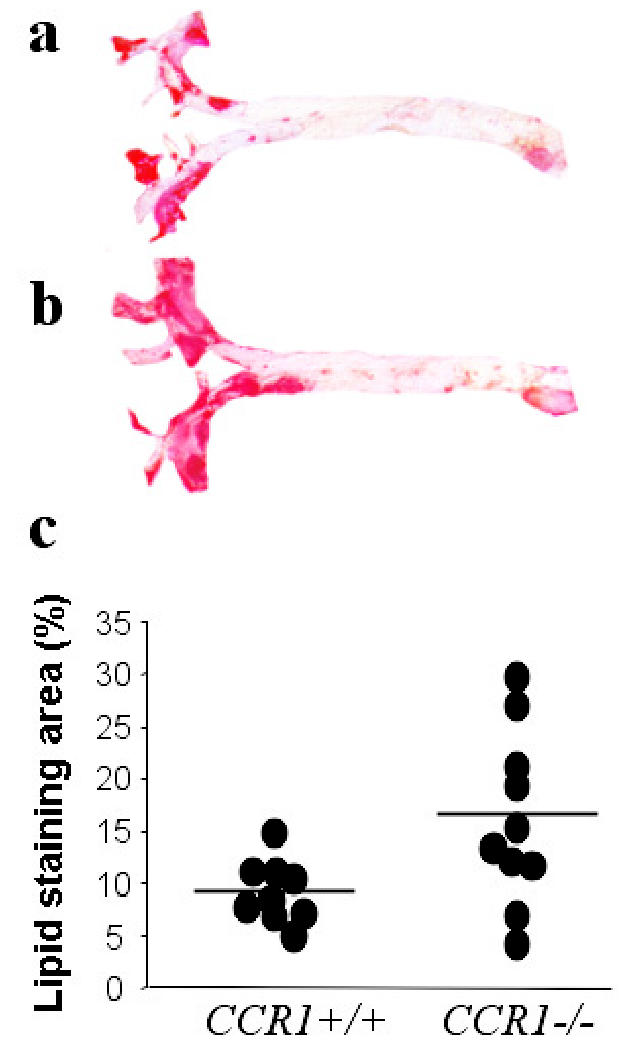
Figure 2.

Representative photomicrographs showing oil red O staining in the thoracic aorta of CCR1+/+ (a) and CCR1−/− (b) mice. Using computer-assisted quantitative analysis (c), we found a 70% increase in the percentage of lipid area in CCR1−/− mice.
