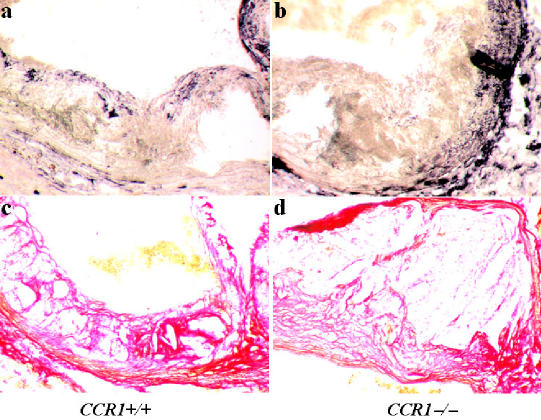
Figure 5.
Representative photomicrographs showing immunostaining for α-actin (smooth muscle cells) (dark blue in a, b) and staining using Sirius red (collagen) (red in c, d) in transversal sections from the aortic sinus of CCR1+/+ (a, c) and CCR1−/− (b, d) mice. We found a 76% decrease in smooth muscle cell accumulation and a 30% decrease in collagen content in lesions of CCR1−/− mice. Original magnifications × 200.

