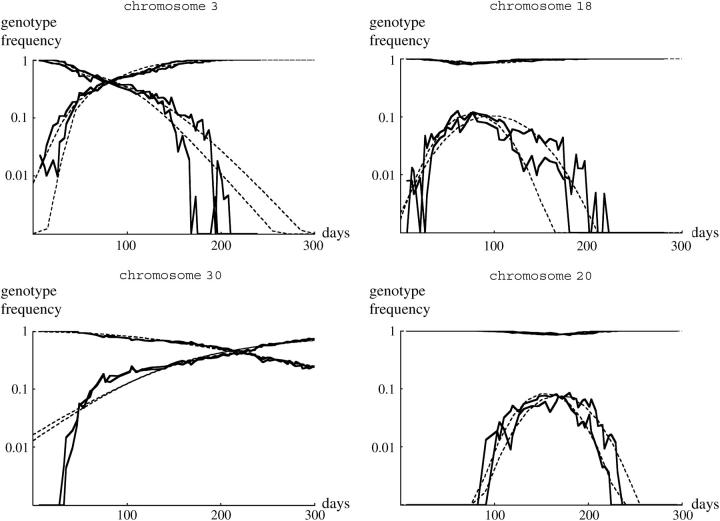
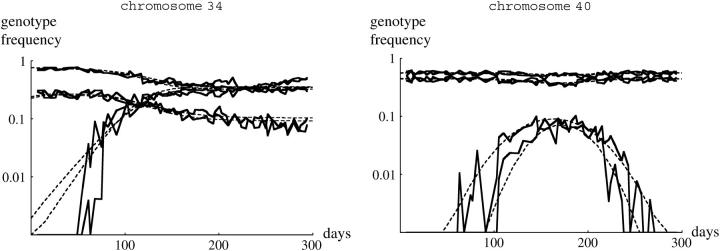
Figure 1.—
Examples of the changes in genotype frequency through the experiment. Three examples where TM2 invaded successfully are shown (left column), together with three examples where TM2 was seen only transiently (right column). The top two rows shows wild-type chromosomes that are recessive lethal, while the bottom row shows examples where +/+ are viable. Each part shows the increase in TM2/+ frequency and the decrease in TM1/+ frequency for each of the two replicate cages. (Except at low frequency, these are almost indistinguishable on this scale.) Where wild-type homozygotes are viable, their frequency is also shown; this is the bottom set of curves for chromosome 34 (bottom left) and the top set for chromosome 40 (bottom right). The pairs of dashed curves give the best-fitting theoretical prediction, separately for each replicate (supplementary Table S1, http://www.genetics.org/supplemental/).


