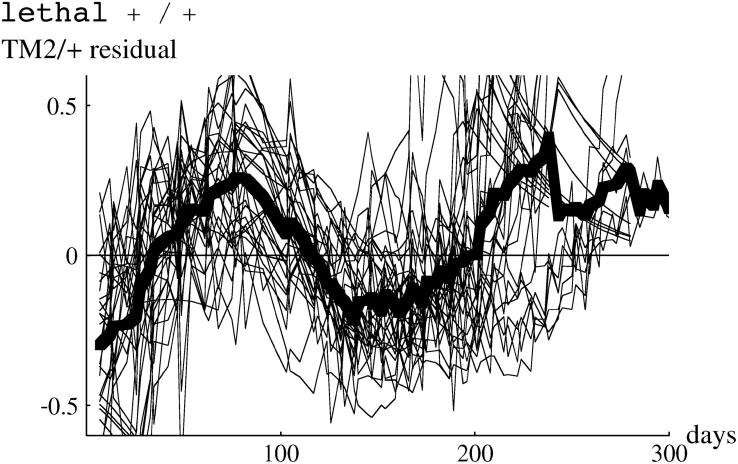
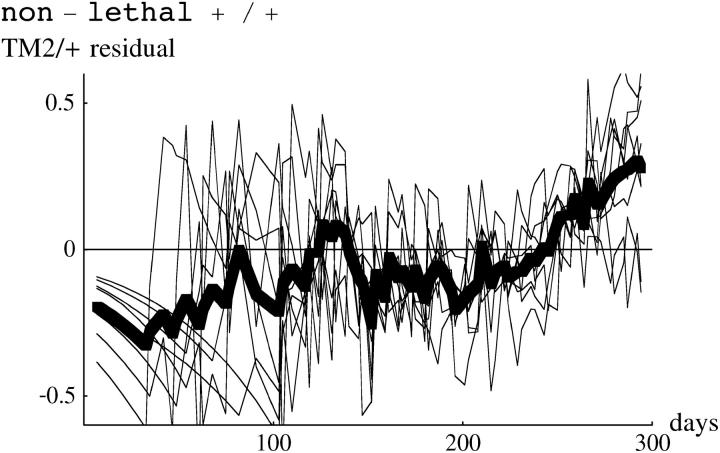
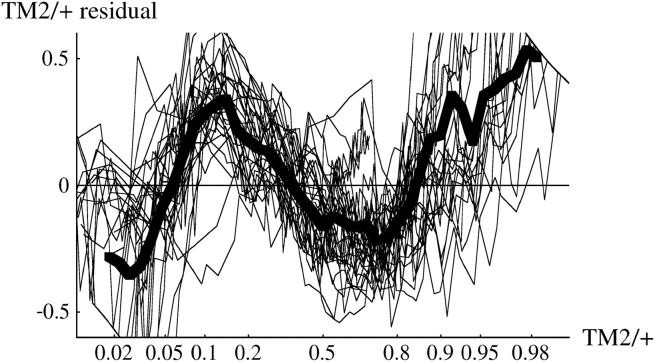
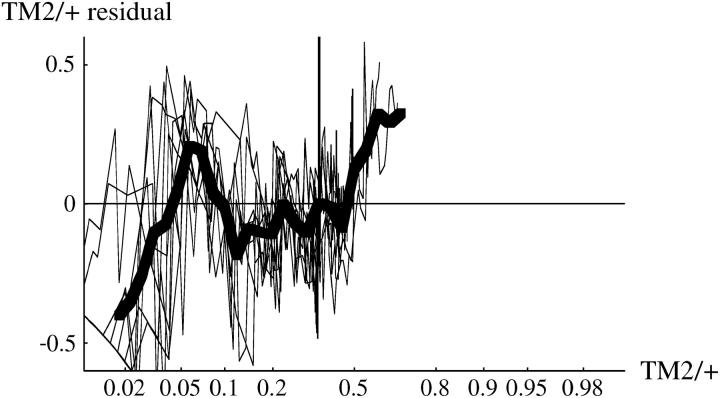
Figure 10.—
Residual deviations of TM2/+ genotype frequency from the fitted model. The left column shows the 15 lethal invader lines, and the right column shows the 4 nonlethal invader lines. The thin lines show residuals for each cage, and the thick line shows the overall average. The top row shows the residuals plotted against time, while the bottom row shows residuals plotted against predicted TM2/+ frequency, on a logit scale.


