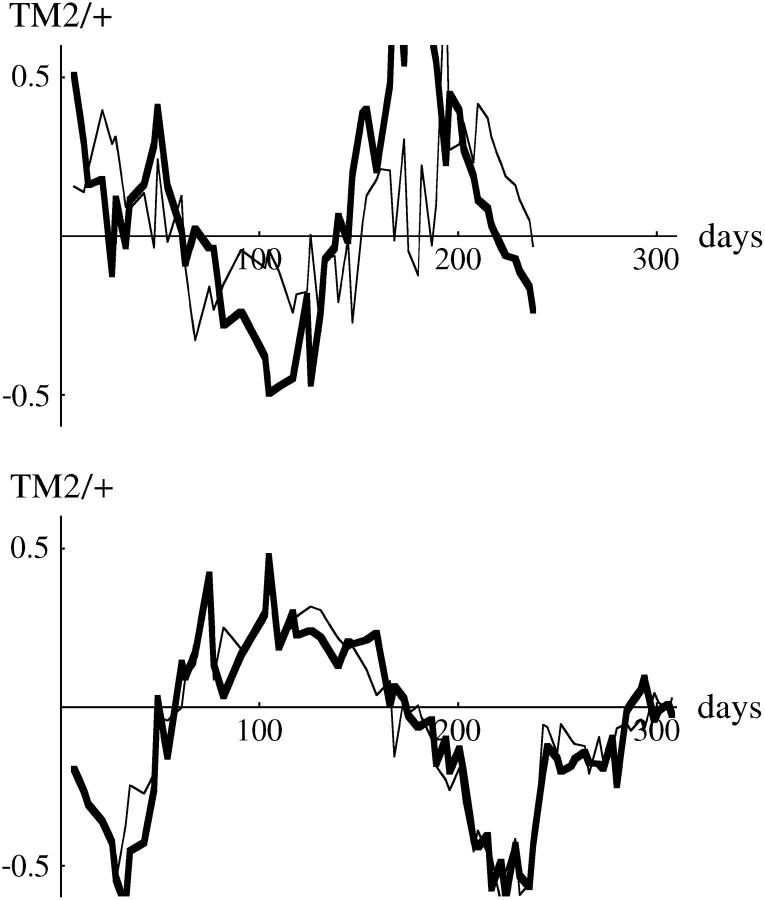
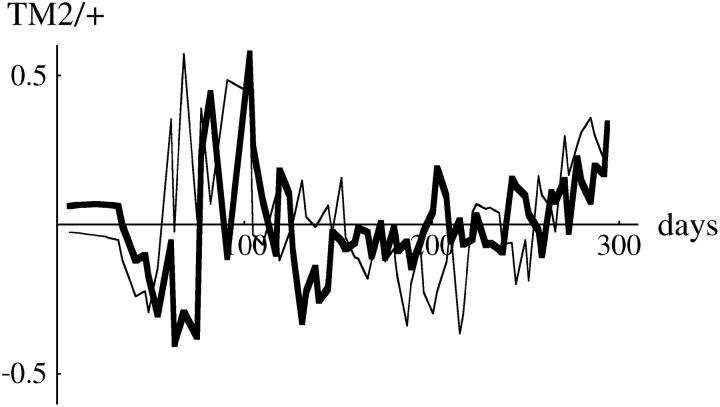
Figure 11.—
Examples of residual deviations from the fitted model, for the three chromosomes shown in Figure 1 (left). (Top to bottom, chromosomes 3, 30, and 34). Each graph shows the deviation in arcsine-transformed frequency of TM2/+, for the two replicate cages (thin and thick lines). The overall mean deviation (Figure 10, top row, thick line) has been subtracted, so that these plots show the deviations peculiar to each chromosome line.


