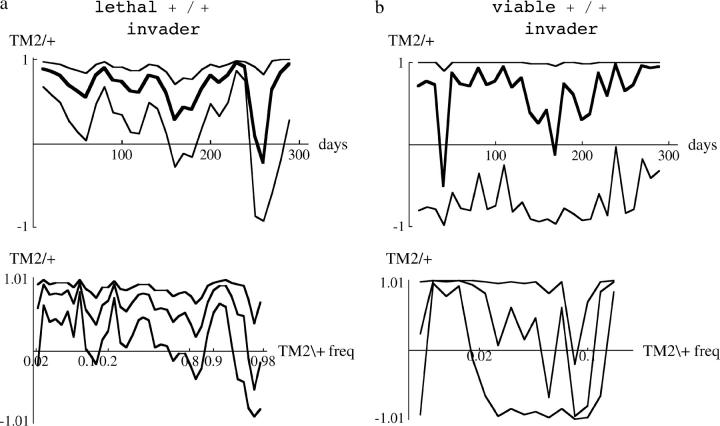
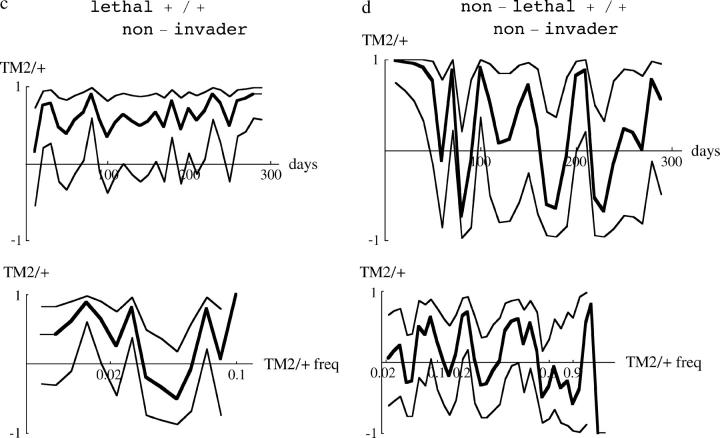
Figure 12.—
Correlations of residual deviations between replicates. The thick line shows the correlation within a moving window, while the thin lines show 95% confidence intervals (using Fisher's tanh approximation). Correlations are plotted against time for the top of a–d and against frequency for the bottom of a–d, as in Figure 10.


