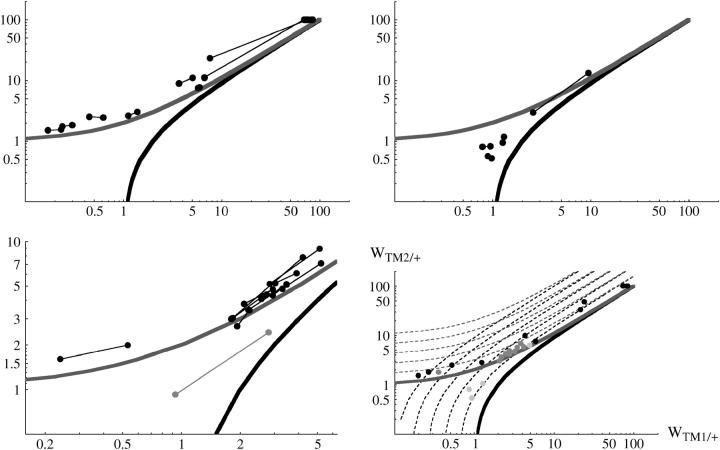
Figure 2.—
Estimated fitnesses of TM2/+ and TM1/+, relative to TM1/TM2, for those cases where TM2 invaded successfully. These estimates are made assuming constant fitnesses. In each part, the top heavy curve shows the threshold for elimination of TM1, and the bottom heavy curve shows the threshold for invasion of TM2; thus, wild-type chromosomes with fitnesses between the two curves can remain polymorphic with both TM1 and TM2 present. Pairs of replicates are linked by lines. Top left, the 15 chromosomes for which +/+ was lethal. In six cases, the estimated TM1/TM2 fitness was extremely low. These are shown by pairs of circles superimposed at top right. Top right, the 4 chromosomes for which +/+ was viable. Bottom left, the 12 chromosomes from Fowler et al. (1997). (Note the narrower range of fitnesses.) The pair of shaded circles shows line 52, in which TM2 invaded but did not displace TM1. Bottom right, comparison between all three classes. For clarity, only the geometric means of replicate estimates are shown, so that pairs of points are replaced by a single point midway between. Solid circles, +/+ lethal; dark-shaded circles, from Fowler et al. (1997); light-shaded circles, +/+ viable. The dashed contours show the initial rate of increase of TM2 per generation (steeper curves) and the final rate of elimination of TM1 (shallower curves); contours are for increase by 100.2, 100.4, … 10 per generation.

