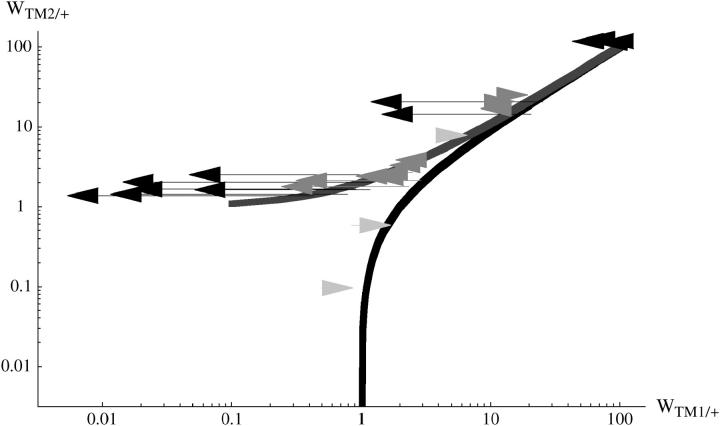
Figure 6.—
Changes in fitness estimated for the invader lines. Each arrow shows estimates for a particular chromosome line, averaged over the two replicates. The base of the arrow gives fitness estimates at the beginning and the tip fitnesses at the end. Solid arrows, +/+ lethal (this experiment); dark-shaded arrows, from Fowler et al. (1997); light-shaded arrows, +/+ viable.

