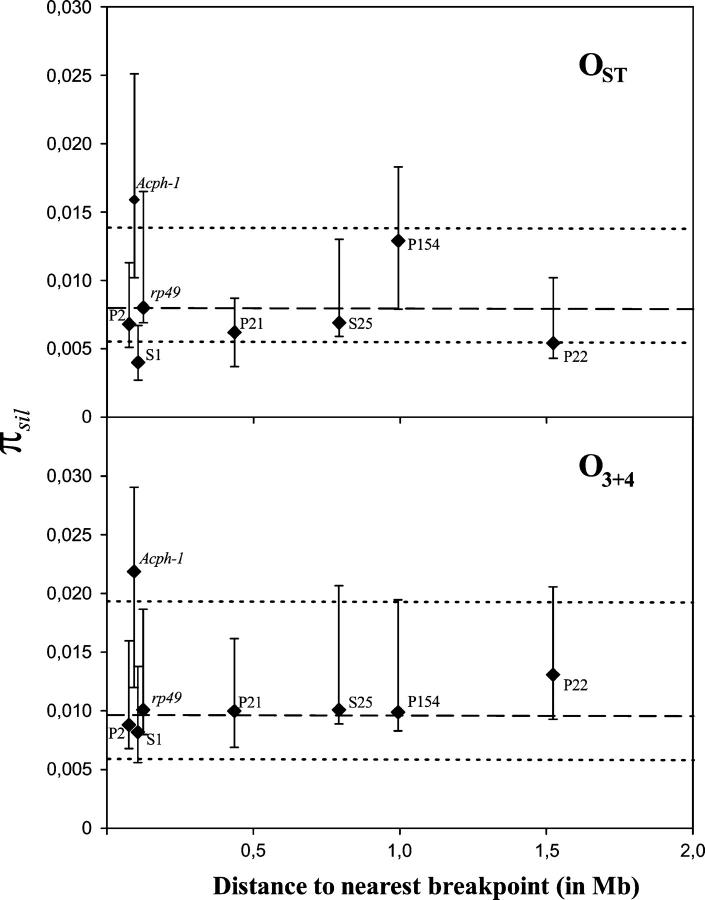
Figure 3.—
Silent nucleotide diversity (πsil) in the OST (top) and O3+4 (bottom) arrangements in each of the eight gene regions analyzed vs. distance to the nearest breakpoint of the O3 inversion. πsil estimates (diamonds) for each region and their 95% confidence intervals (vertical lines) are presented. Dashed and dotted horizontal lines show πsil estimates within arrangements in the concatenated data set and the 95% confidence interval. Distance to the nearest breakpoint was inferred as in Figure 2.

