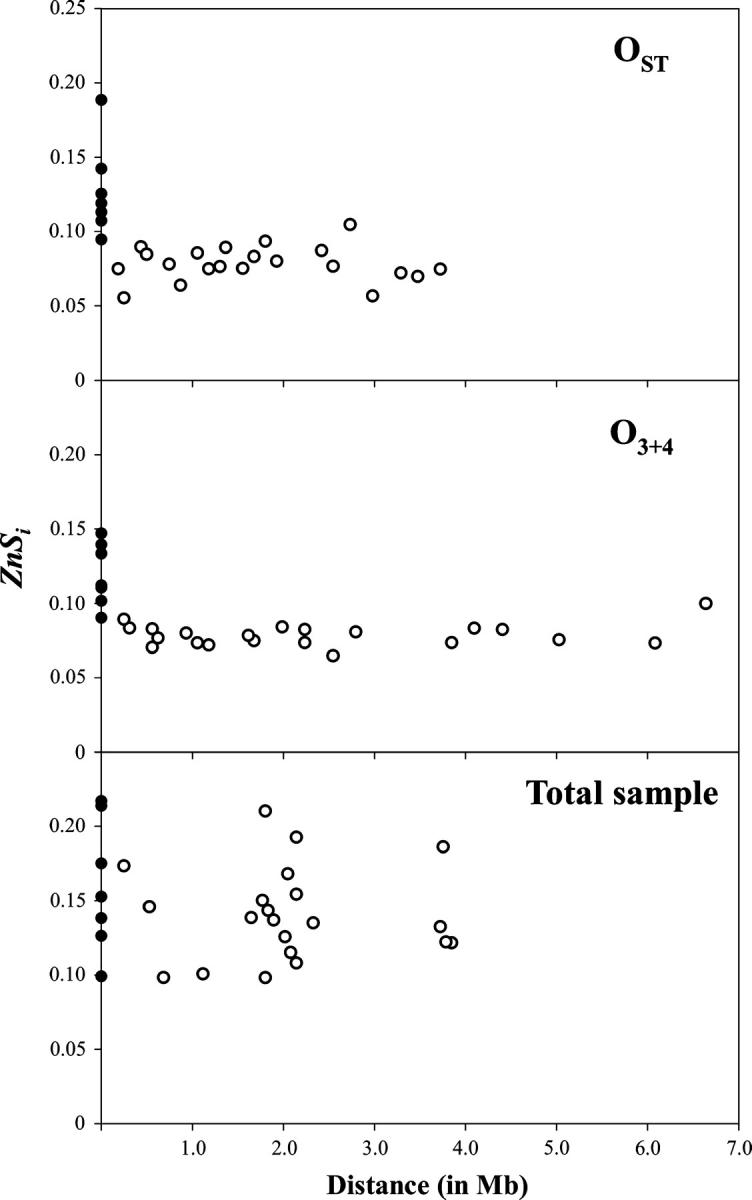
Figure 4.—

Interlocus LD (open circles) in each chromosomal arrangement and in the total sample plotted vs. interlocus distance. Intralocus LD (solid circles) is also shown. Pairwise distances between regions are different in OST and O3+4 since these arrangements differ by two inversions (Figure 1); in the total sample, distances between regions were estimated as the average of the distances in OST and O3+4.
